PLATEAU Tokyo 23-Ku: Explore Tokyo Through 3D Maps, Transportation, and Environmental Data
PLATEAU Tokyo 23-Ku combines PLATEAU 3D city models with JR East trains, Toei buses, bike share, JARTIC traffic, JMA rainfall, and air quality data. Learn how Cesium and 3D Tiles create a shared urban visualization environment for smart city and digital twin applications.
On this page
- 1. Introduction
- 2. What is PLATEAU?
- 3. Technologies Used
- Cesium
- 3D Tiles
- PLATEAU 3D City Models
- Traffic and Environmental Data Sources
- 4. Features of the Demo
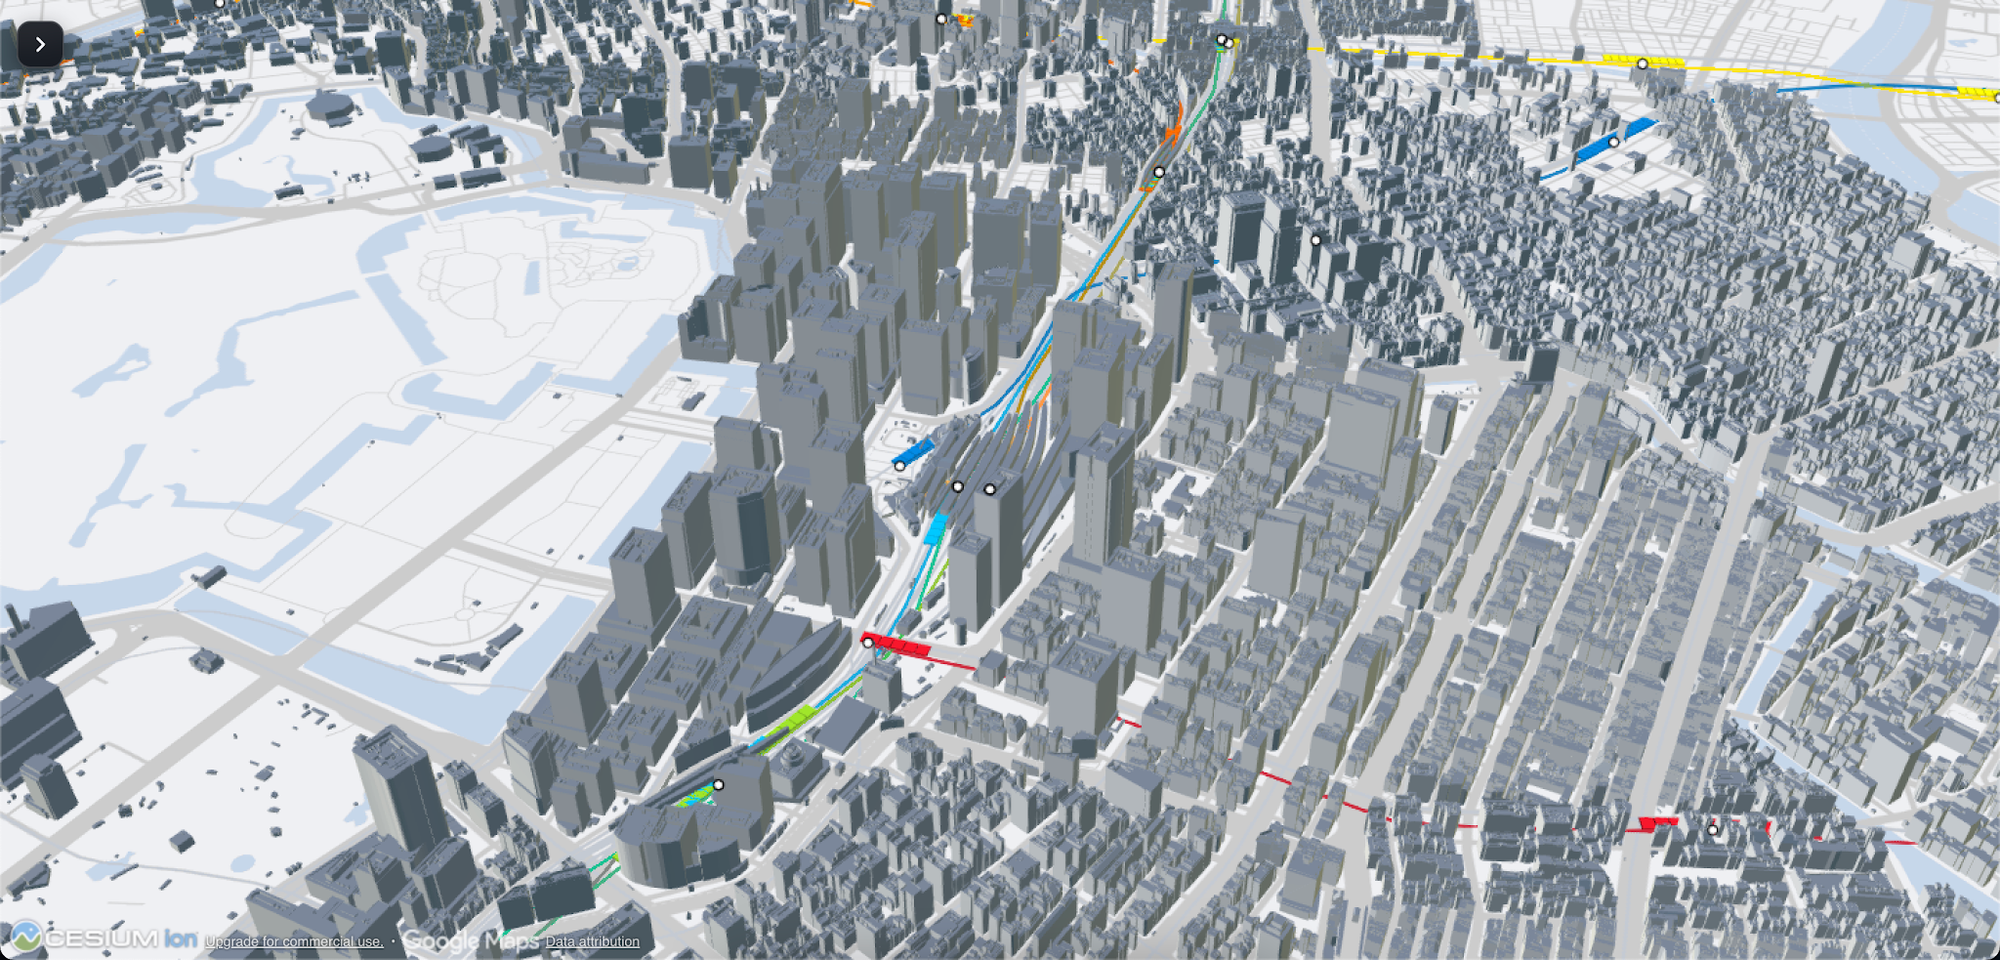
- 4.1. 3D Visualization of Tokyo's 23 Wards
- 4.2. PLATEAU-Based 3D City Models
- 4.3. Visualization of JR East Trains
- 4.4. Visualization of Toei Buses (Buses – Toei)
- 4.5. Visualization of Bike Share Systems (Bike Share)
- 4.6. Visualization of Road Traffic Conditions (Traffic – JARTIC)
- 4.7. Visualization of Rainfall (Rain – JMA)
- 4.8. Visualization of Air Quality (Air Quality)
- 4.9. Combining Multiple Data Layers on a Single Map
- 4.10. Interactive Map Controls and Exploration
- 5. Overview of Data Layers
- 6. Train Data Simulation and Update Mechanism
- 7. Value of Combining Urban Data
- 7.1. Creating a Comprehensive View of the City
- 7.2. Connecting Cross-Domain Data
- 7.3. Supporting Smart City Application Development
- 8. Potential Applications
- Urban Planning
- Traffic Management
- Environmental Monitoring
- Digital Twin Development
- Urban Simulation and Analysis
- 9. Key Considerations
- 10. Conclusion
1. Introduction
Tokyo is one of the largest and most complex metropolises in the world, with high building density, an extensive public transportation network, and continuous urban activities. Observing this entire environment through traditional 2D maps sometimes makes it difficult to visualize the relationships between structures, transportation systems, and environmental conditions.
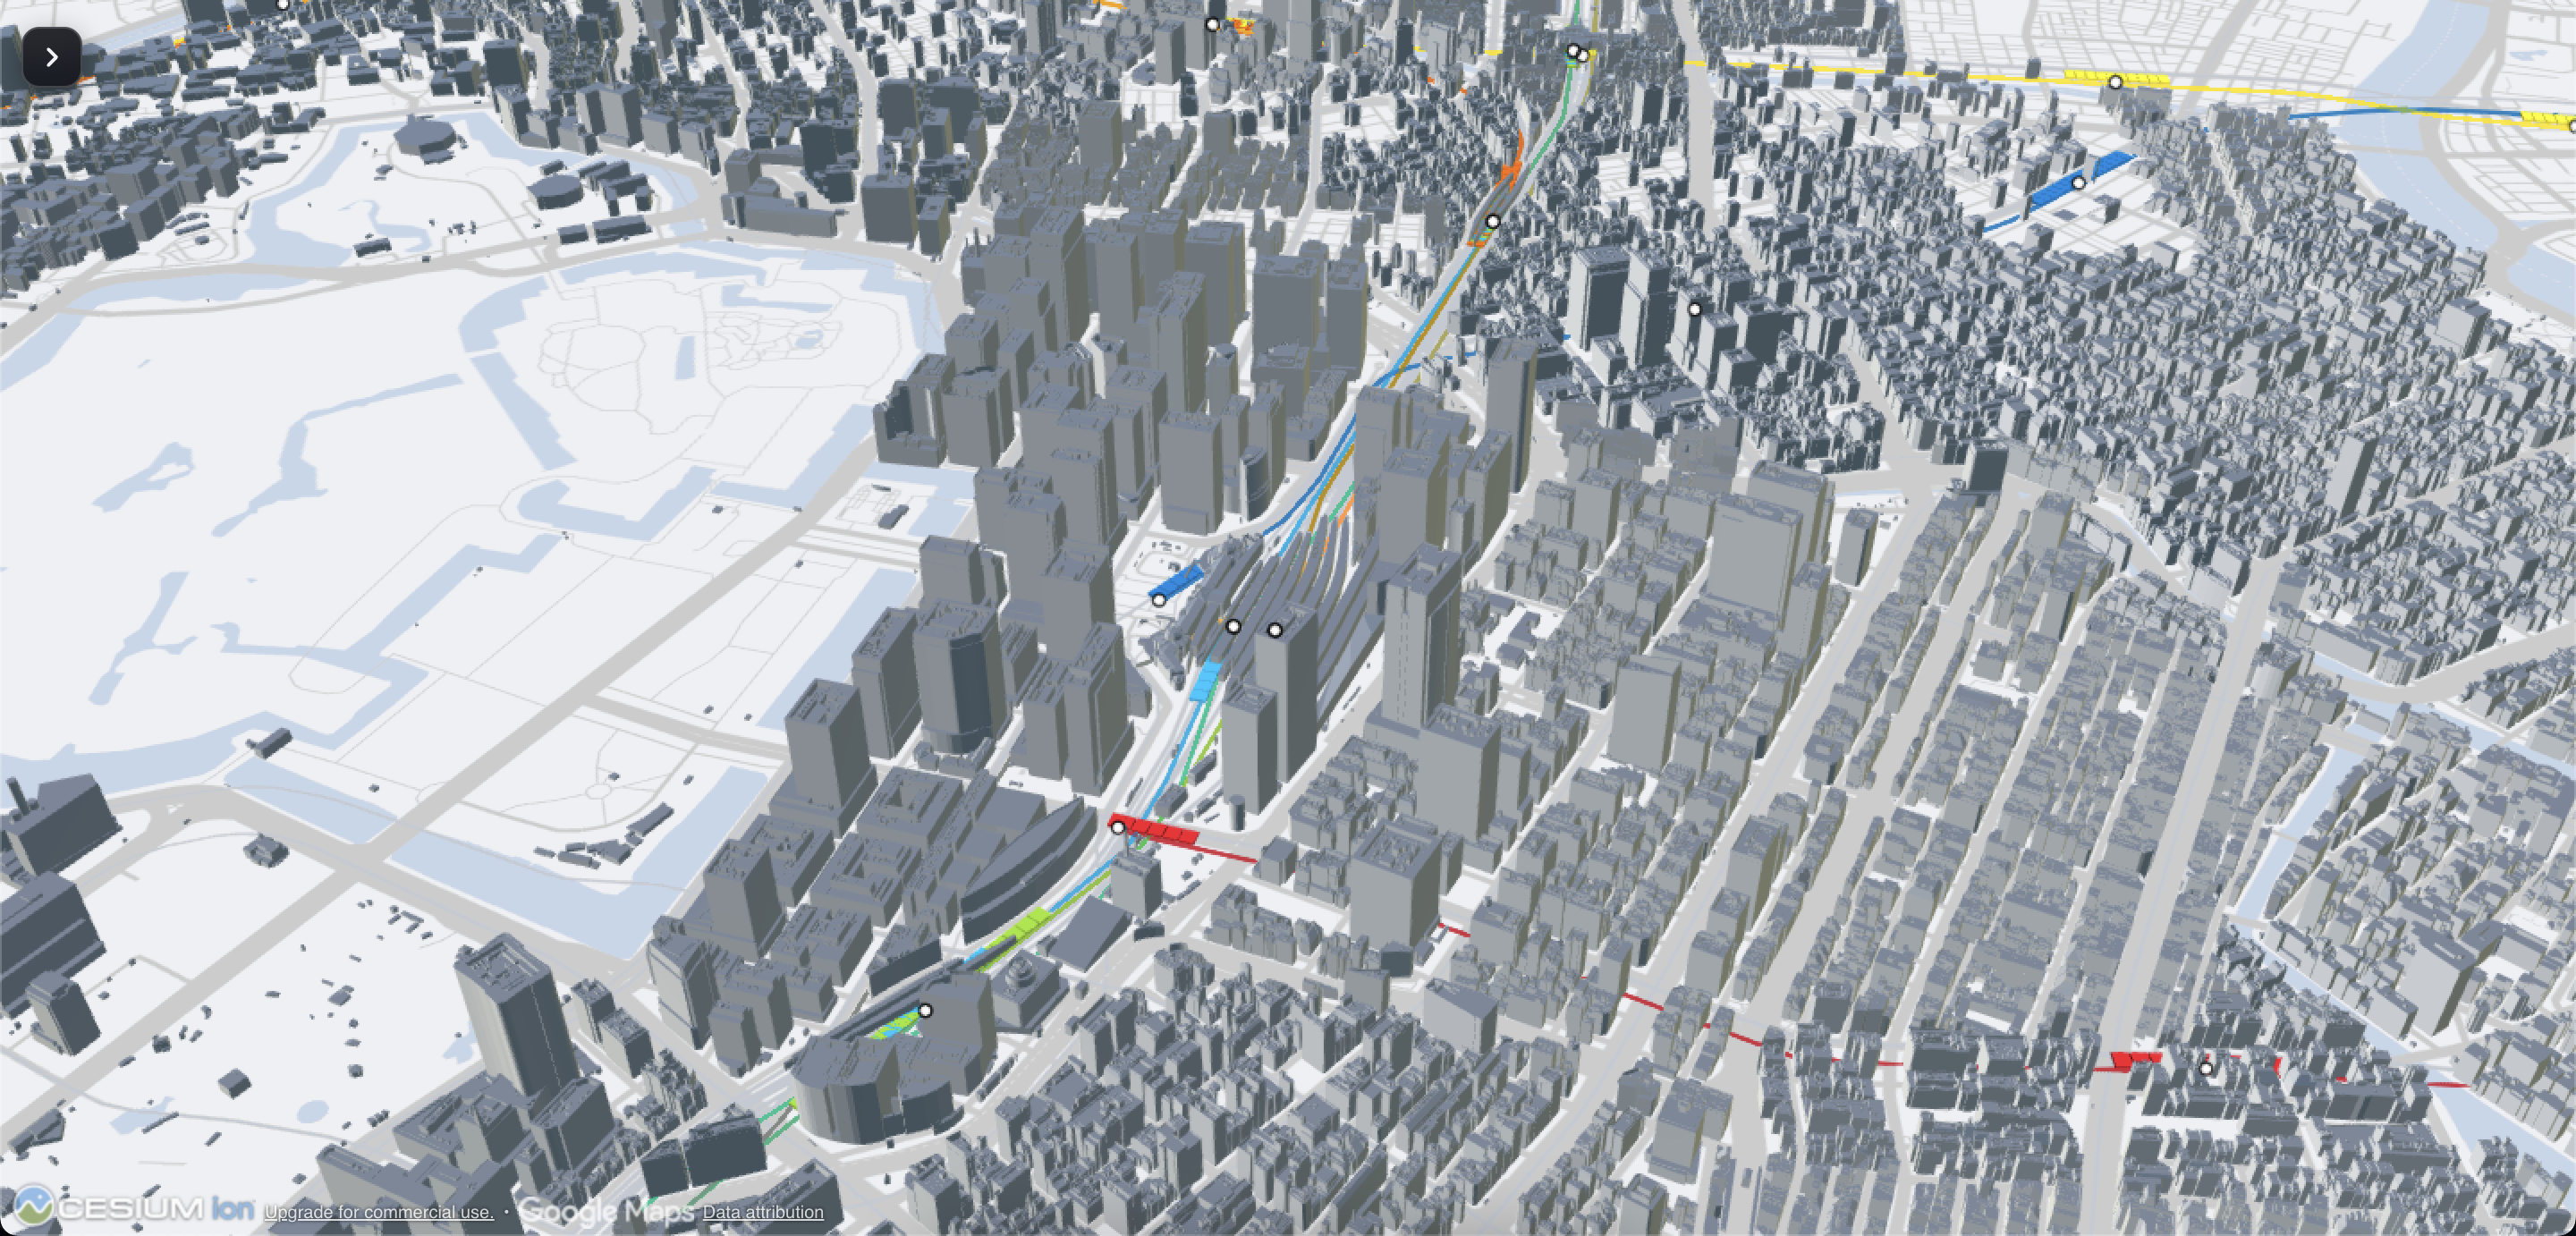
To explore the capabilities of urban visualization technology, we developed PLATEAU Tokyo 23-Ku, an interactive 3D demo combining city models with traffic, weather, and environmental data.
The demo uses Cesium and 3D Tiles to render Tokyo's urban environment in three-dimensional space while integrating multiple data layers, including JR East trains, Toei buses, bike-sharing systems, road traffic conditions, rainfall, and air quality.
Instead of merely viewing buildings on a static 3D map, users can explore various aspects of the city through data layers integrated into the same geographic environment.
Experience the live demo:https://innovation-lab.vitalify.asia/en/gallery/plateau-tokyo23ku
2. What is PLATEAU?
PLATEAU is a project by Japan's Ministry of Land, Infrastructure, Transport and Tourism (MLIT) aimed at developing and providing open 3D city models across Japan.
These models recreate urban environments using structured 3D data. Depending on the dataset, they may include building geometry, structural attributes, and related spatial information.
PLATEAU data can be utilized across various fields:
- Urban planning and development.
- Disaster prevention and risk assessment.
- Traffic analysis and mobility assessment.
- Visualization of environmental data.
- Smart City application development.
- Building Urban Digital Twins.
- Simulation and analysis of urban scenarios.
In the PLATEAU Tokyo 23-Ku demo, the 3D city model serves as the spatial foundation to display and overlay traffic, weather, and environmental data layers.
3. Technologies Used
The demo combines geospatial visualization technologies with urban and traffic data.
Cesium
Cesium is a 3D geospatial application development platform that supports displaying large-scale geographic data and allows users to interact with 3D environments.
In the demo, Cesium provides the environment to explore the city of Tokyo and observe data layers within a geographic context.
3D Tiles
3D Tiles is a format designed to efficiently stream and render large-scale 3D geospatial datasets.
This technology enables organizing data into smaller chunks to serve streaming and rendering on demand, suitable for city visualization applications.
PLATEAU 3D City Models
PLATEAU 3D city models provide urban data as the foundation for the visualization scene.
Thanks to the 3D models, users can observe structures and the built environment in relation to other information layers.
Traffic and Environmental Data Sources
The demo integrates dataset groups related to public transit, road traffic, weather, and air quality.
This combination helps extend the role of 3D maps from displaying urban geometry to visualizing information on city activities and conditions.
4. Features of the Demo
4.1. 3D Visualization of Tokyo's 23 Wards
The primary feature of the demo is displaying Tokyo's urban environment as an interactive 3D map.
Users can explore the city from multiple perspectives, observe the distribution of buildings, and better visualize the scale of the urban environment.
Unlike conventional 2D maps, this approach adds spatial depth, making it more intuitive to observe structures and transit networks.
4.2. PLATEAU-Based 3D City Models
The demo uses PLATEAU city model data to recreate Tokyo's built environment in geographic space.
The 3D model serves as a common spatial baseline for integrated datasets. As a result, users can view traffic and environmental data in relation to surrounding urban areas.
This approach also forms a foundation for expanding applications into urban planning, spatial analysis, and urban simulation.
4.3. Visualization of JR East Trains
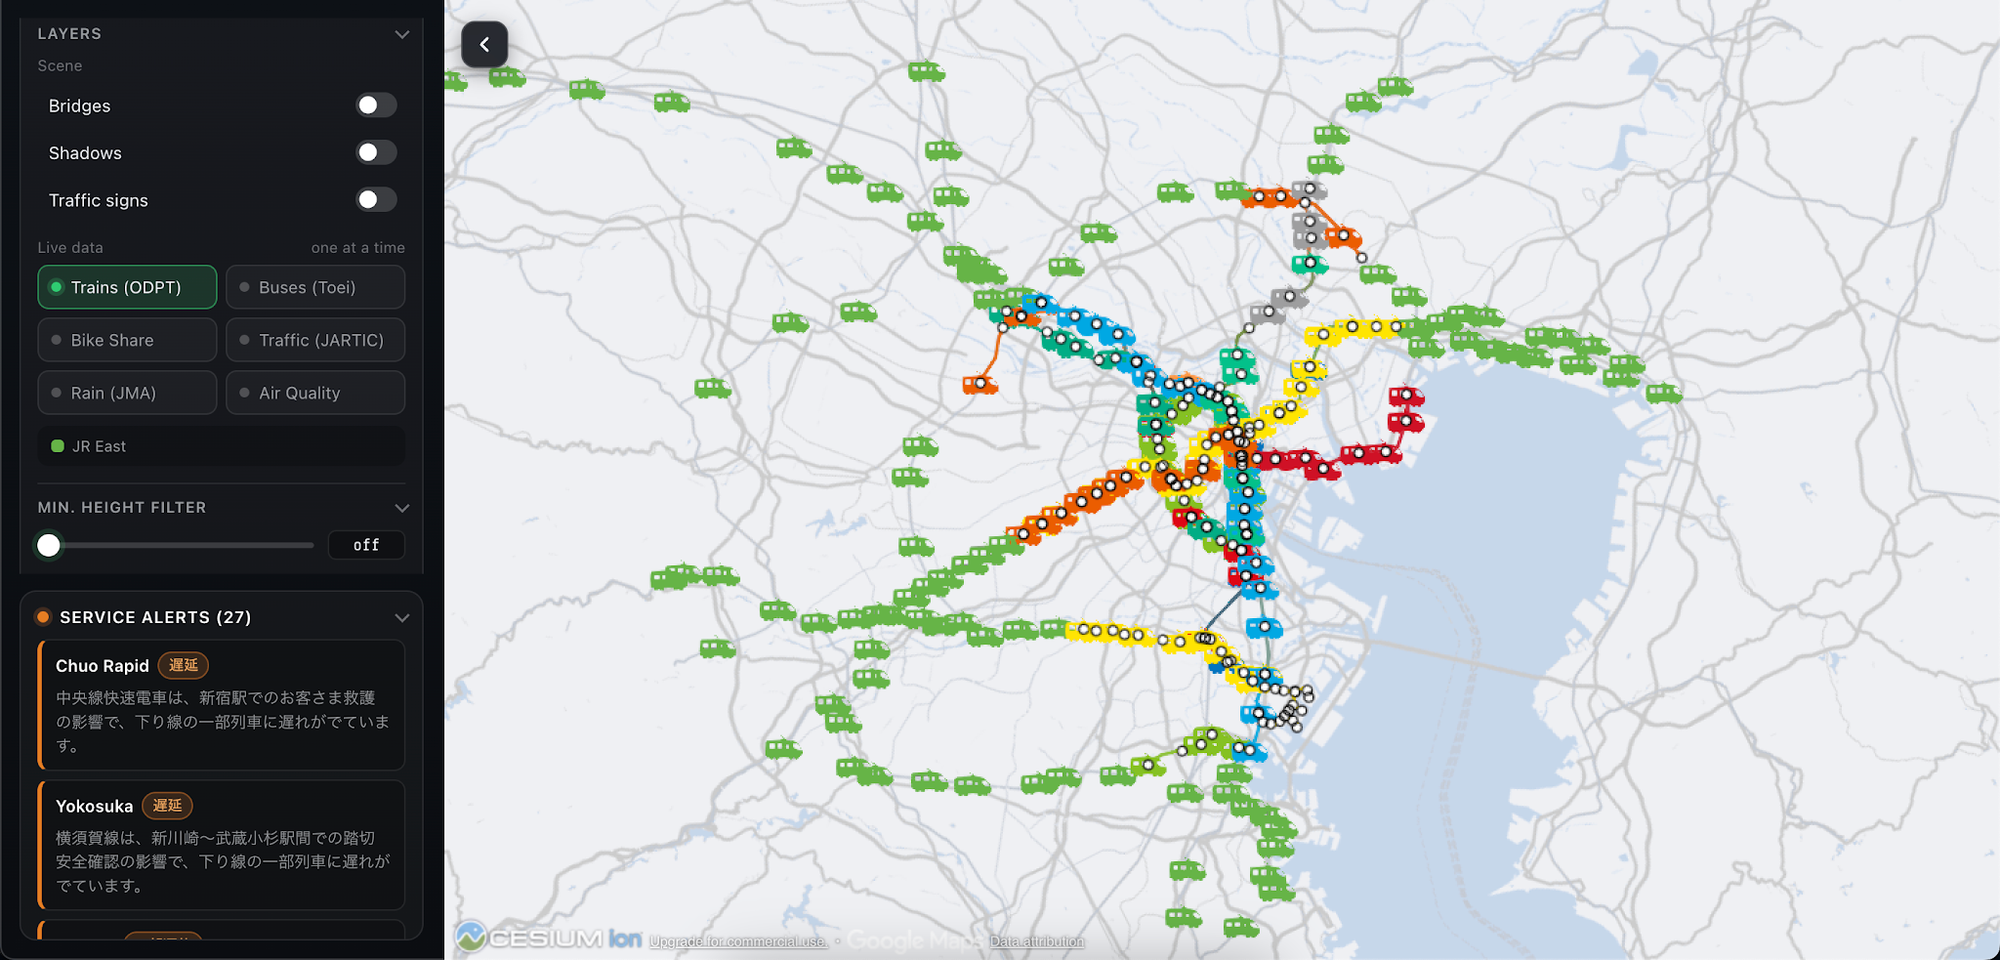
The demo integrates the JR East train data layer to represent railway activity in the 3D city environment.
Rendering trains on the map allows users to observe railway transit operations within Tokyo's geographic context, rather than just viewing route info on a separate transit diagram.
In the current implementation version, the train route simulation logic can use origin and destination fields (From / To) to determine the direction of movement and generate motion for the train.
It is important to distinguish between simulated motion and actual train positions. The accuracy of positions, routes, and speeds depends on the source data as well as the processing methods used.
4.4. Visualization of Toei Buses (Buses – Toei)
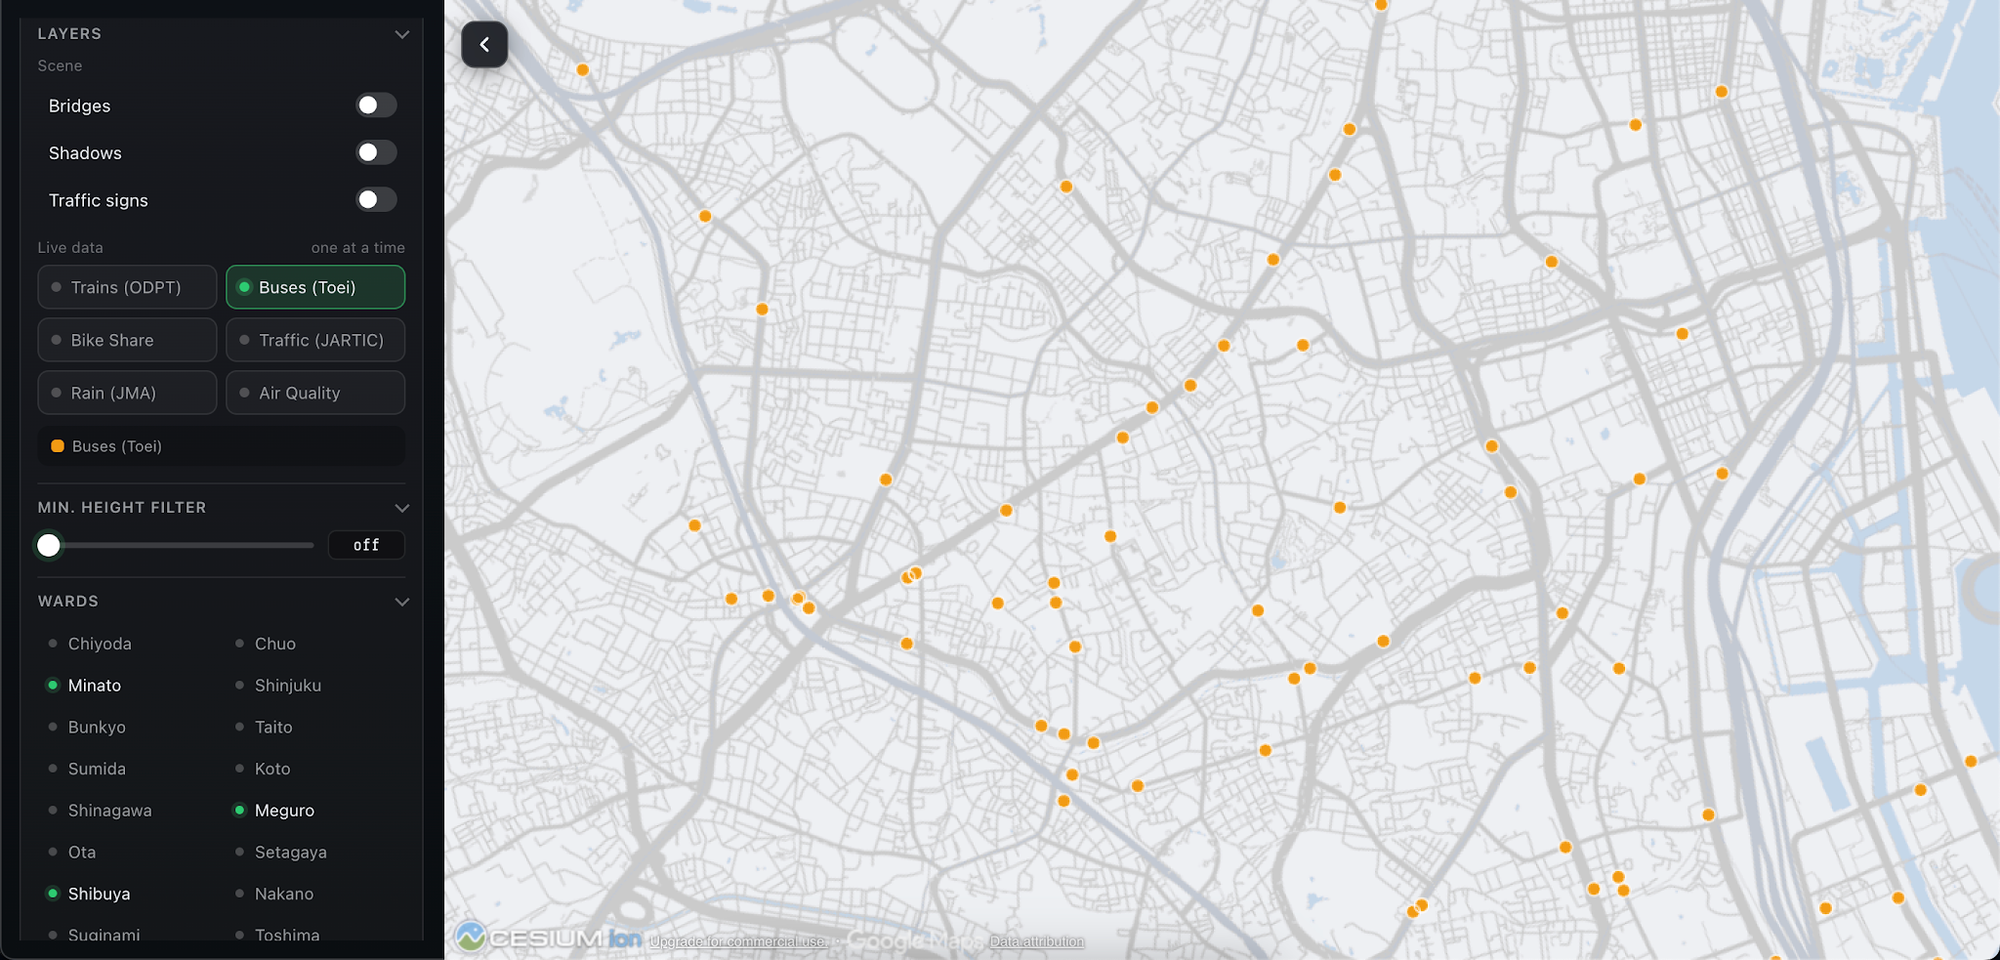
The Buses layer provides visual information on the Toei bus system within the urban environment.
This feature adds a perspective on surface public transit alongside the JR East railway system.
When placed in the same 3D environment, bus data helps illustrate how different public transportation modes coexist within the city.
This also serves as a useful foundation for developing applications to analyze connectivity between bus routes, stations, and other urban areas.
4.5. Visualization of Bike Share Systems (Bike Share)
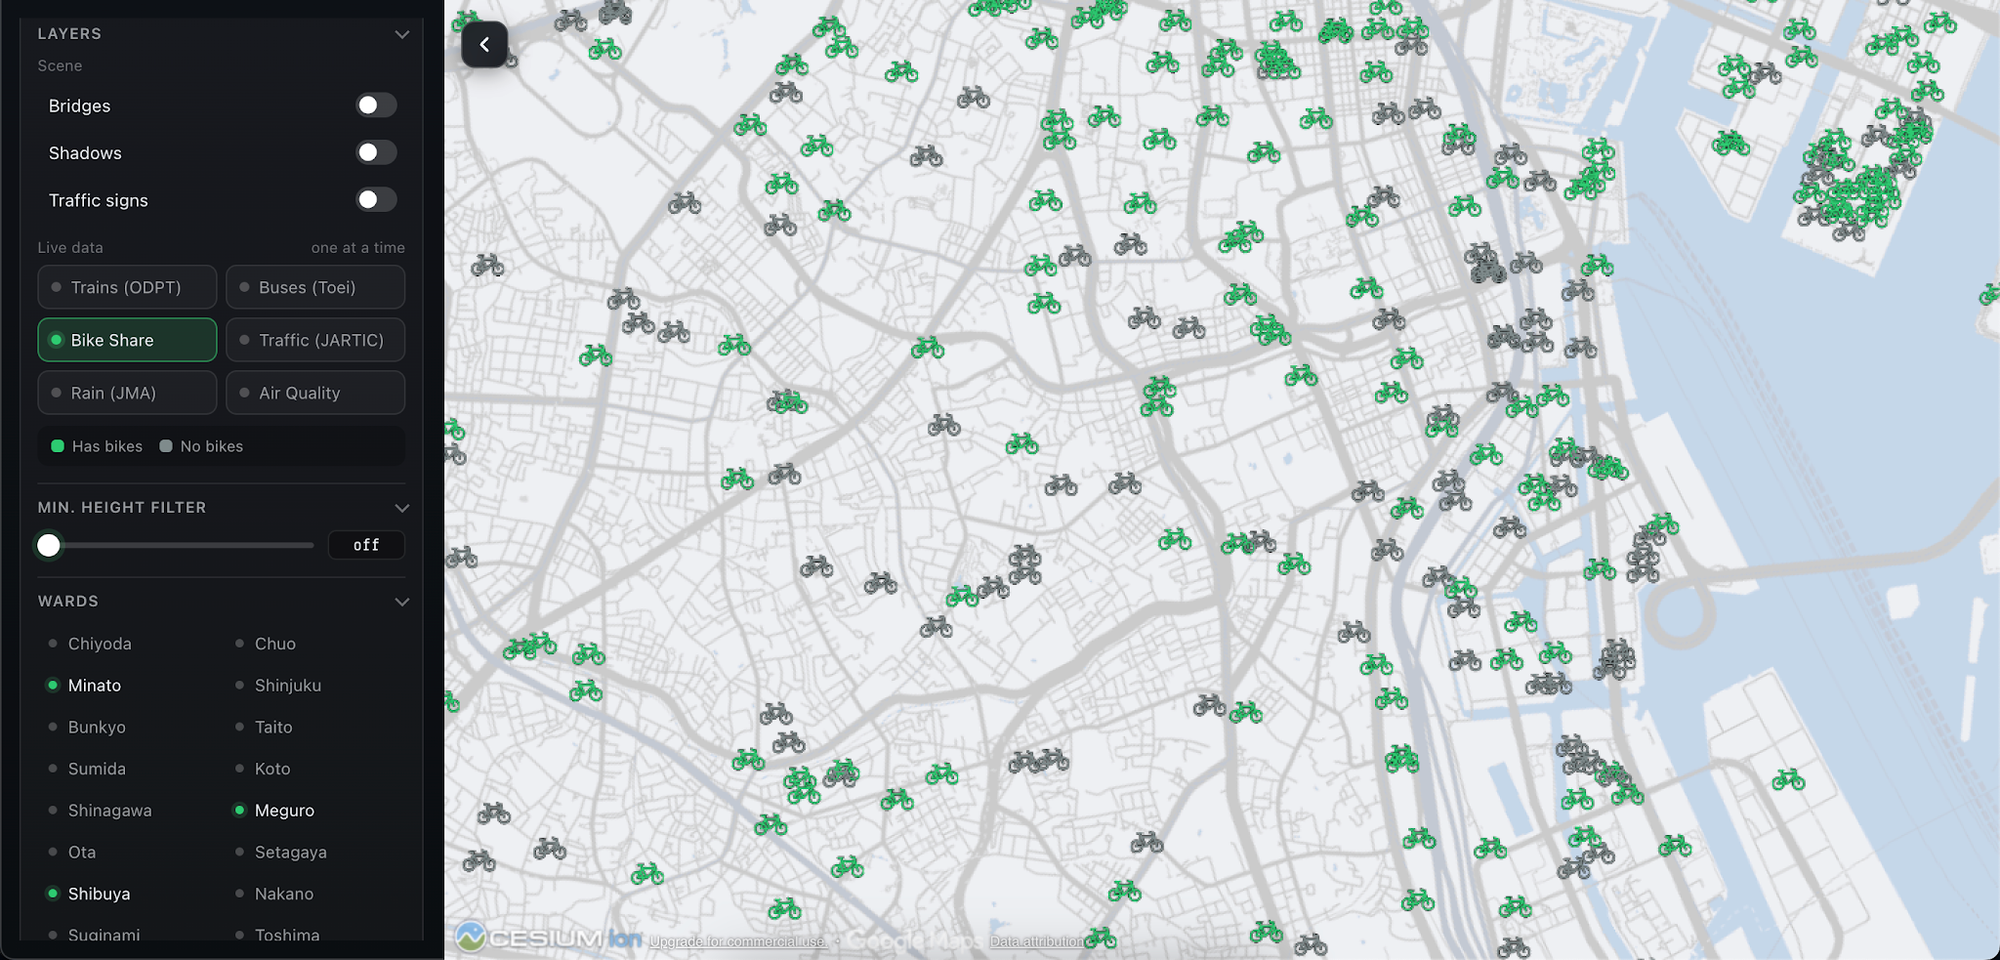
Bike Share is a data layer for the bicycle sharing system in Tokyo.
Integrating this data expands the visualization scope from public transit to flexible micro-mobility modes in the city.
When combined with JR East trains and Toei buses, the Bike Share layer contributes to painting a multi-modal picture of urban mobility.
For example, bike-sharing data can support understanding the relationship between bike trip points and public transit networks, depending on the actual information provided by the data source.
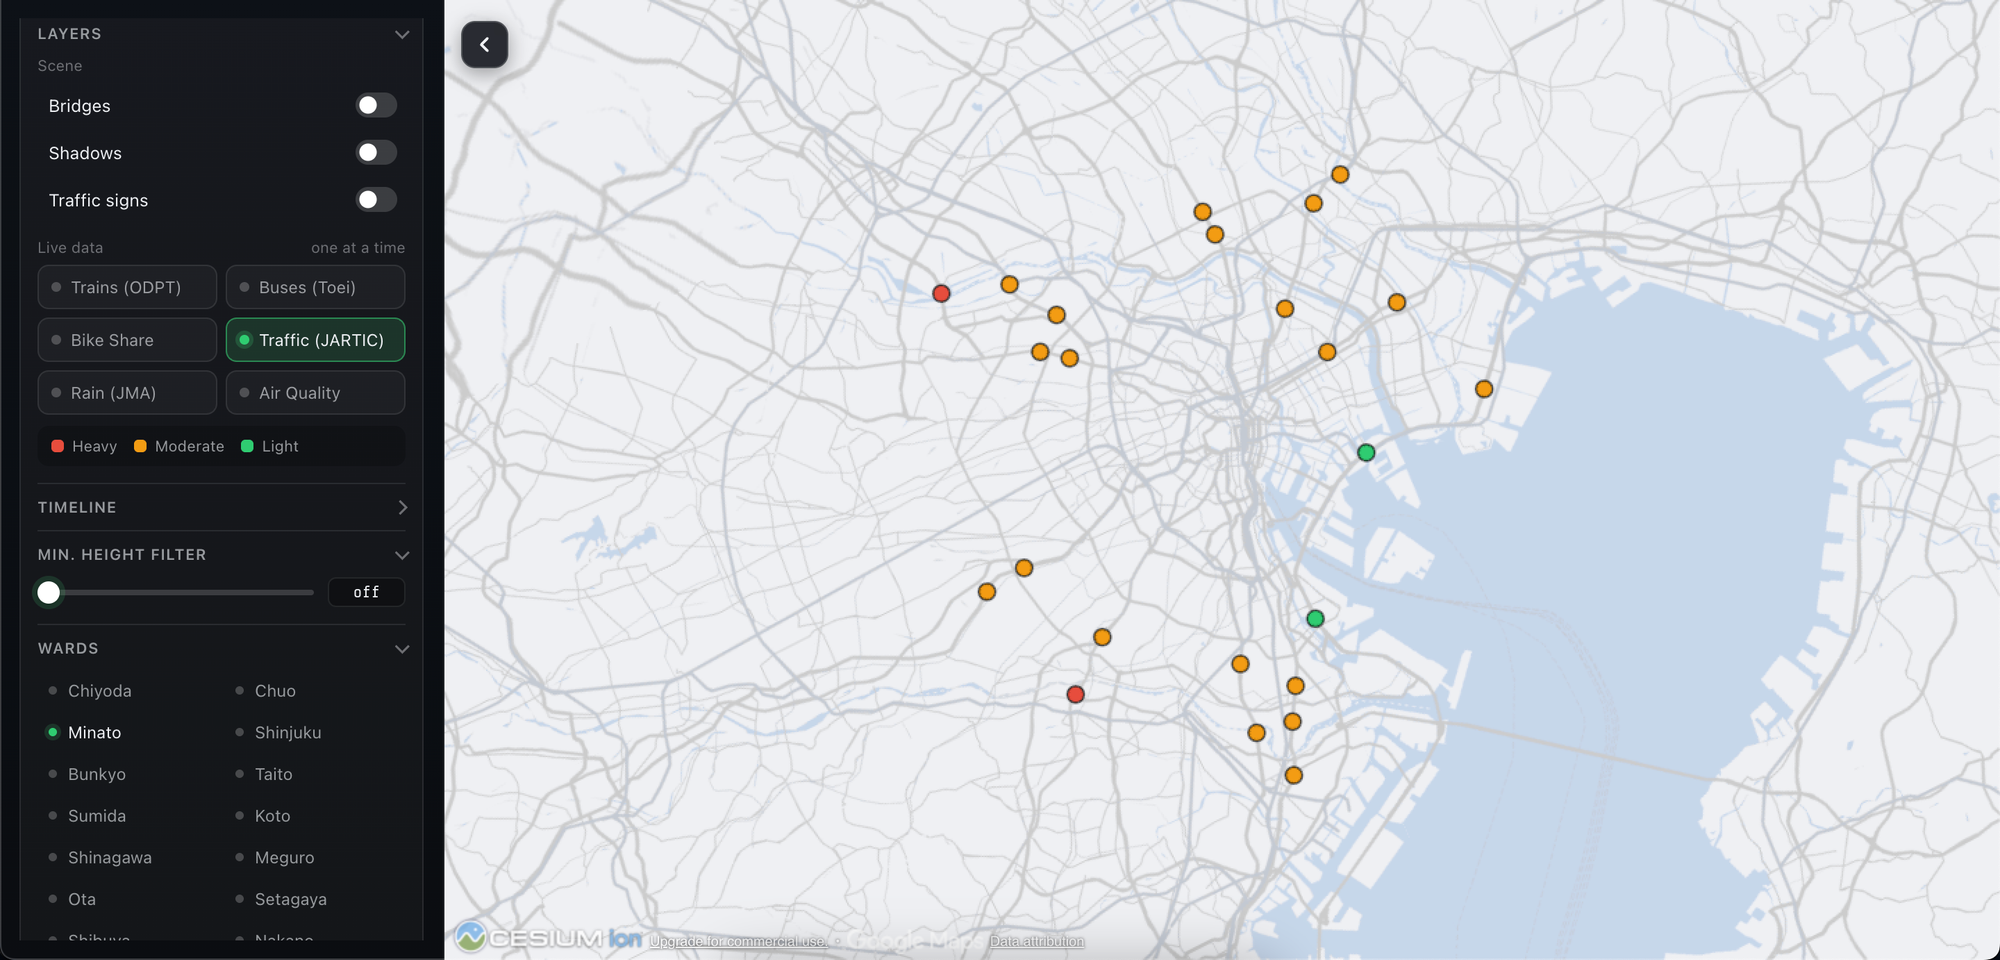
4.6. Visualization of Road Traffic Conditions (Traffic – JARTIC)
The demo integrates the Traffic layer using data from JARTIC (Japan Road Traffic Information Center).
This data layer adds road traffic information into the 3D visualization environment.
When combined with rail and bus data, road traffic information broadens the perspective from individual transport modes to the overall urban transportation system.
This approach holds potential for applications in observing traffic status, analyzing mobility, and developing urban management support systems.
Specific details such as congestion levels, vehicle speeds, or road segment statuses depend on the type of JARTIC data used in the demo.
4.7. Visualization of Rainfall (Rain – JMA)
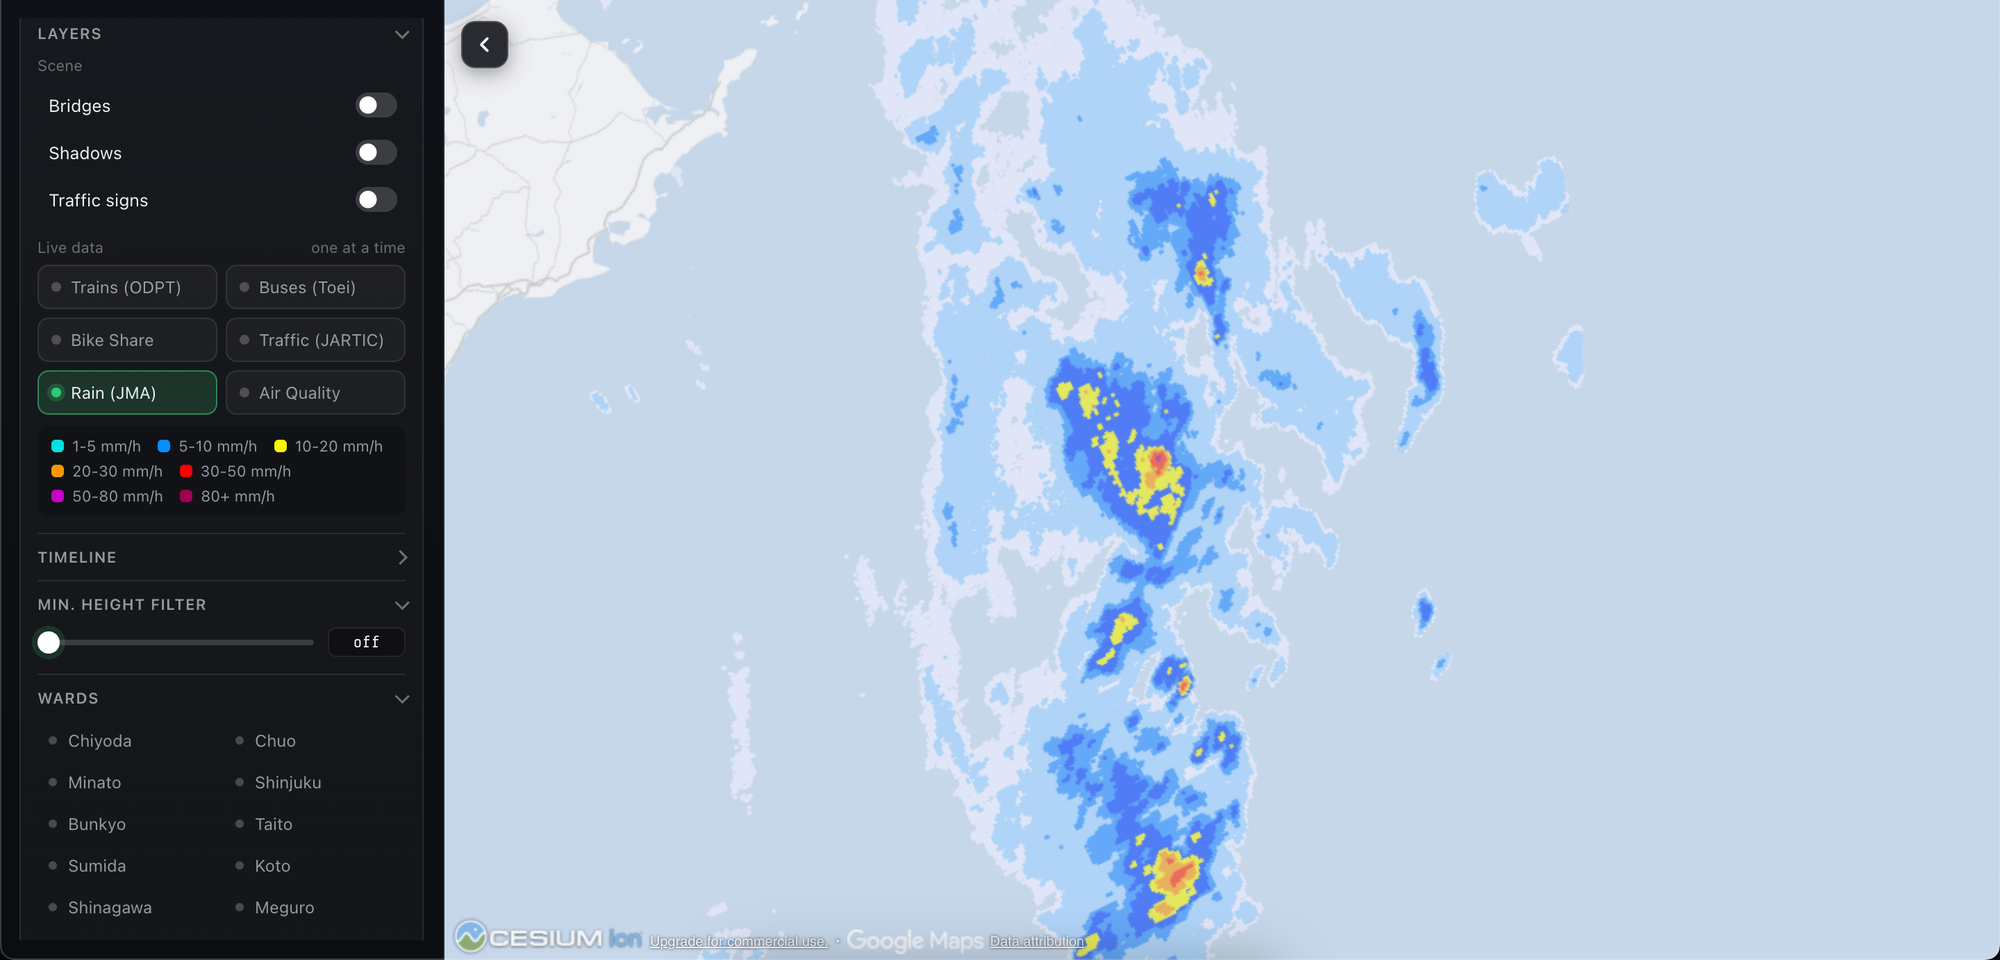
The Rain layer integrates rainfall data from the JMA (Japan Meteorological Agency).
Weather data is brought onto the map environment so users can observe precipitation information in the city's geographic context.
Combining meteorological data with 3D urban models opens up opportunities to study the correlation between weather and city activities.
For instance, rain data can be useful when analyzing travel conditions, evaluating heavy-rain vulnerable areas, or building urban management support applications.
Note that rainfall data reflects meteorological conditions according to the spatial extent and time frame provided by the data source; it should not be assumed that every map location has direct sensor measurements.
4.8. Visualization of Air Quality (Air Quality)
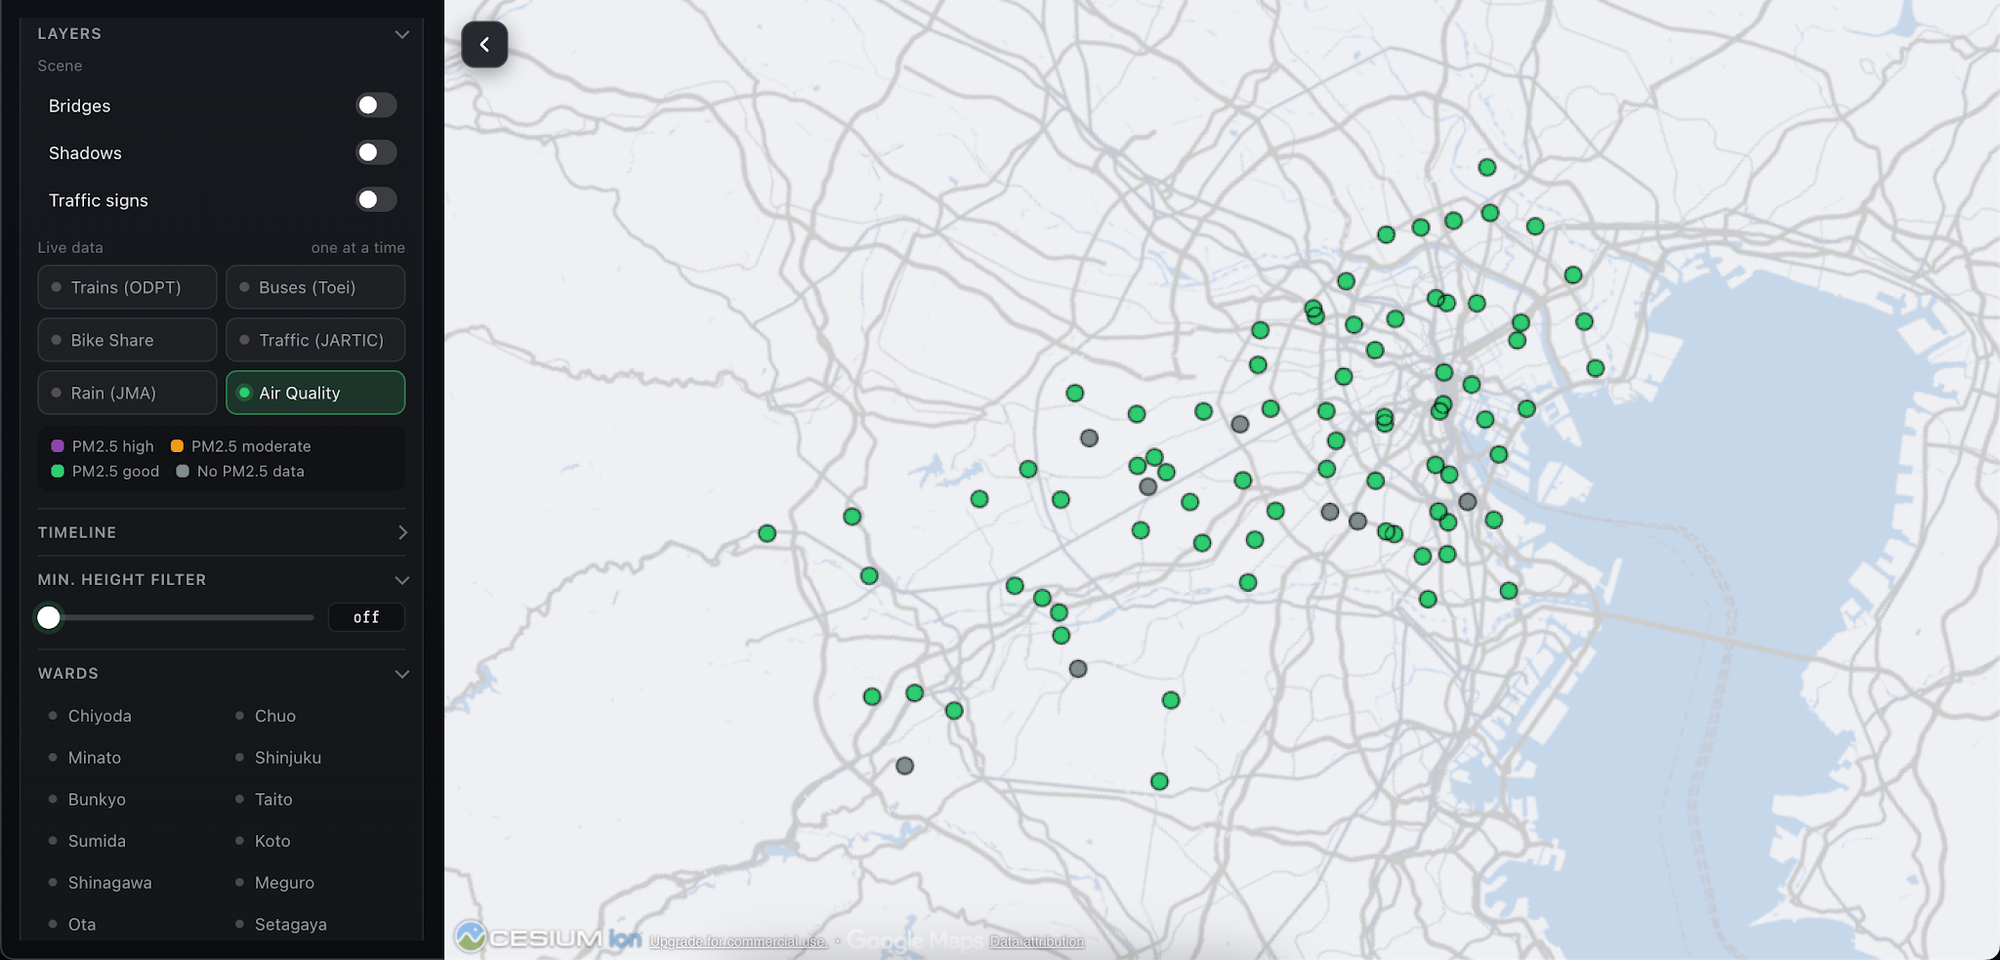
The Air Quality layer adds air quality information to Tokyo's 3D map.
When combined with traffic, weather, and city model data, this layer expands the observation scope into urban environmental aspects.
Air quality information can support understanding the regional distribution of environmental metrics, provided the source data supplies corresponding spatial information.
In smart city applications, combining air quality data with traffic and weather can form a basis for deeper research into living environments.
Specific metrics such as PM2.5, PM10, NO₂, or AQI should only be specified as actual demo data when confirmed that the data source provides those indices.
4.9. Combining Multiple Data Layers on a Single Map
One of the highlights of the demo is the ability to aggregate multiple information groups into a single geospatial visualization environment.
Main data layers include:
- PLATEAU: 3D City Model.
- JR East: Train data and visualization.
- Toei Buses: Bus data.
- Bike Share: Bike-sharing system data.
- JARTIC Traffic: Road traffic data.
- JMA Rain: Rainfall data.
- Air Quality: Air quality data.
Each layer contributes a distinct perspective of the city. Combined, they create a multi-domain visualization environment, allowing simultaneous observation of urban structure, transportation activity, and environmental factors.
This approach demonstrates the potential of 3D maps as a unified interface for exploring city data, rather than using disparate tools for each information type.
4.10. Interactive Map Controls and Exploration
The 3D map interface allows users to interact with the urban environment to observe displayed regions and data.
Traffic, weather, and environmental data layers offer varied perspectives on the same geographical space.
Specific controls and options, such as toggling individual data layers on or off, should be verified against the current demo interface before describing detailed actions.
5. Overview of Data Layers
The section above summarizes the data layers used in the demo based on existing deployment details. Data sources, update frequencies, precision, and information scopes may vary by layer.
6. Train Data Simulation and Update Mechanism
For train visualization, the workflow can be described in the following steps:
- Data Collection: Fetch train-related information from the data source.
- Read Origin and Destination: Use From and To fields to determine movement direction or route to simulate.
- Calculate Simulated Position: Determine train location on the represented route.
- Generate Movement: Update displayed position over time to simulate train movement.
- Data Refresh: Receive new values when the data source updates.
Based on current deployment specs, the display status may take around two minutes to reflect new values. Actual intervals depend on update routines and source data.
Crucially, one must distinguish between API-supplied data and values computed by the app to animate movement. Continuous simulation does not imply continuous reception of real-time train coordinates.
7. Value of Combining Urban Data
7.1. Creating a Comprehensive View of the City
When 3D city models are merged with traffic and environmental datasets, users can explore multiple facets of Tokyo within a single workspace.
Rather than viewing an isolated dataset, users gain a better understanding of the spatial context that data represents.
7.2. Connecting Cross-Domain Data
Transportation, meteorology, and air quality are often managed in separate data systems.
Overlaying these layers onto a unified visualization platform illustrates how cross-domain data can be placed in a shared geographic context.
7.3. Supporting Smart City Application Development
The demo architecture can serve as a groundwork for smart city applications, where 3D models act as the visual interface for urban data.
With appropriate data sources added, the system can expand to support traffic monitoring, environmental tracking, or infrastructure status visualization.
8. Potential Applications
Urban Planning
Using 3D city models to observe urban structures and situate traffic, weather, and environmental data in specific spatial contexts.
Traffic Management
Combining train, bus, bike-share, and road traffic data to build a unified perspective on urban mobility systems.
Environmental Monitoring
Integrating air quality and rainfall data to visualize environmental factors across the city space.
Digital Twin Development
Using 3D models as a foundation to integrate data from various systems and build urban digital twins.
Urban Simulation and Analysis
Expanding the system with more detailed data to study traffic scenarios, weather impacts, or structural changes in the urban environment.
These represent potential application directions for this approach and do not imply that all analysis or simulation capabilities are implemented in the current demo.
9. Key Considerations
Although the demo integrates multiple useful data layers, a clear distinction must be made between raw source data and app-simulated or calculated values.
- Train Positions: May depend on source data and simulation logic.
- Routes: Simulated routes should not be assumed to align perfectly with physical tracks.
- Train Speeds: Should only be viewed as actual speeds when confirmed by data providers.
- Traffic Data: Data coverage depends on the integrated JARTIC scope.
- Rainfall Data: Depends on spatial extent, timing, and data delivery methods by JMA.
- Air Quality: Specific metrics rely on the utilized source data.
- Update Frequency: May differ across data sources and display layers.
These factors form an essential foundation for properly interpreting visualized information and guiding future developments.
10. Conclusion
PLATEAU Tokyo 23-Ku illustrates how 3D city models can integrate with diverse urban data types to create an intuitive and engaging city exploration experience.
By combining PLATEAU with JR East, Toei Buses, Bike Share, JARTIC Traffic, JMA Rain, and Air Quality data layers, the demo transforms a 3D map from a simple urban model into a multi-domain visualization environment.
This integration showcases the potential of Cesium, 3D Tiles, and open urban data in building smart city applications and digital twins.
In the future, enhancing traffic data precision, improving sync across sources, and adding relevant analytical tools can turn this system into a more effective platform for urban environment research and exploration.
The core idea of the demo is turning a 3D city model into a shared visualization workspace where building, transit, and environmental data can be explored within a single geographic context.
Experience the live demo:https://innovation-lab.vitalify.asia/en/gallery/plateau-tokyo23ku
Struggling to turn ideas into reality? With a proven track record of over 1,000 clients, our agile and flexible team will accelerate your business growth.