
What Is 3D Tiles? A Complete Guide to Its Core Concepts, Latest Trends, and Use Cases

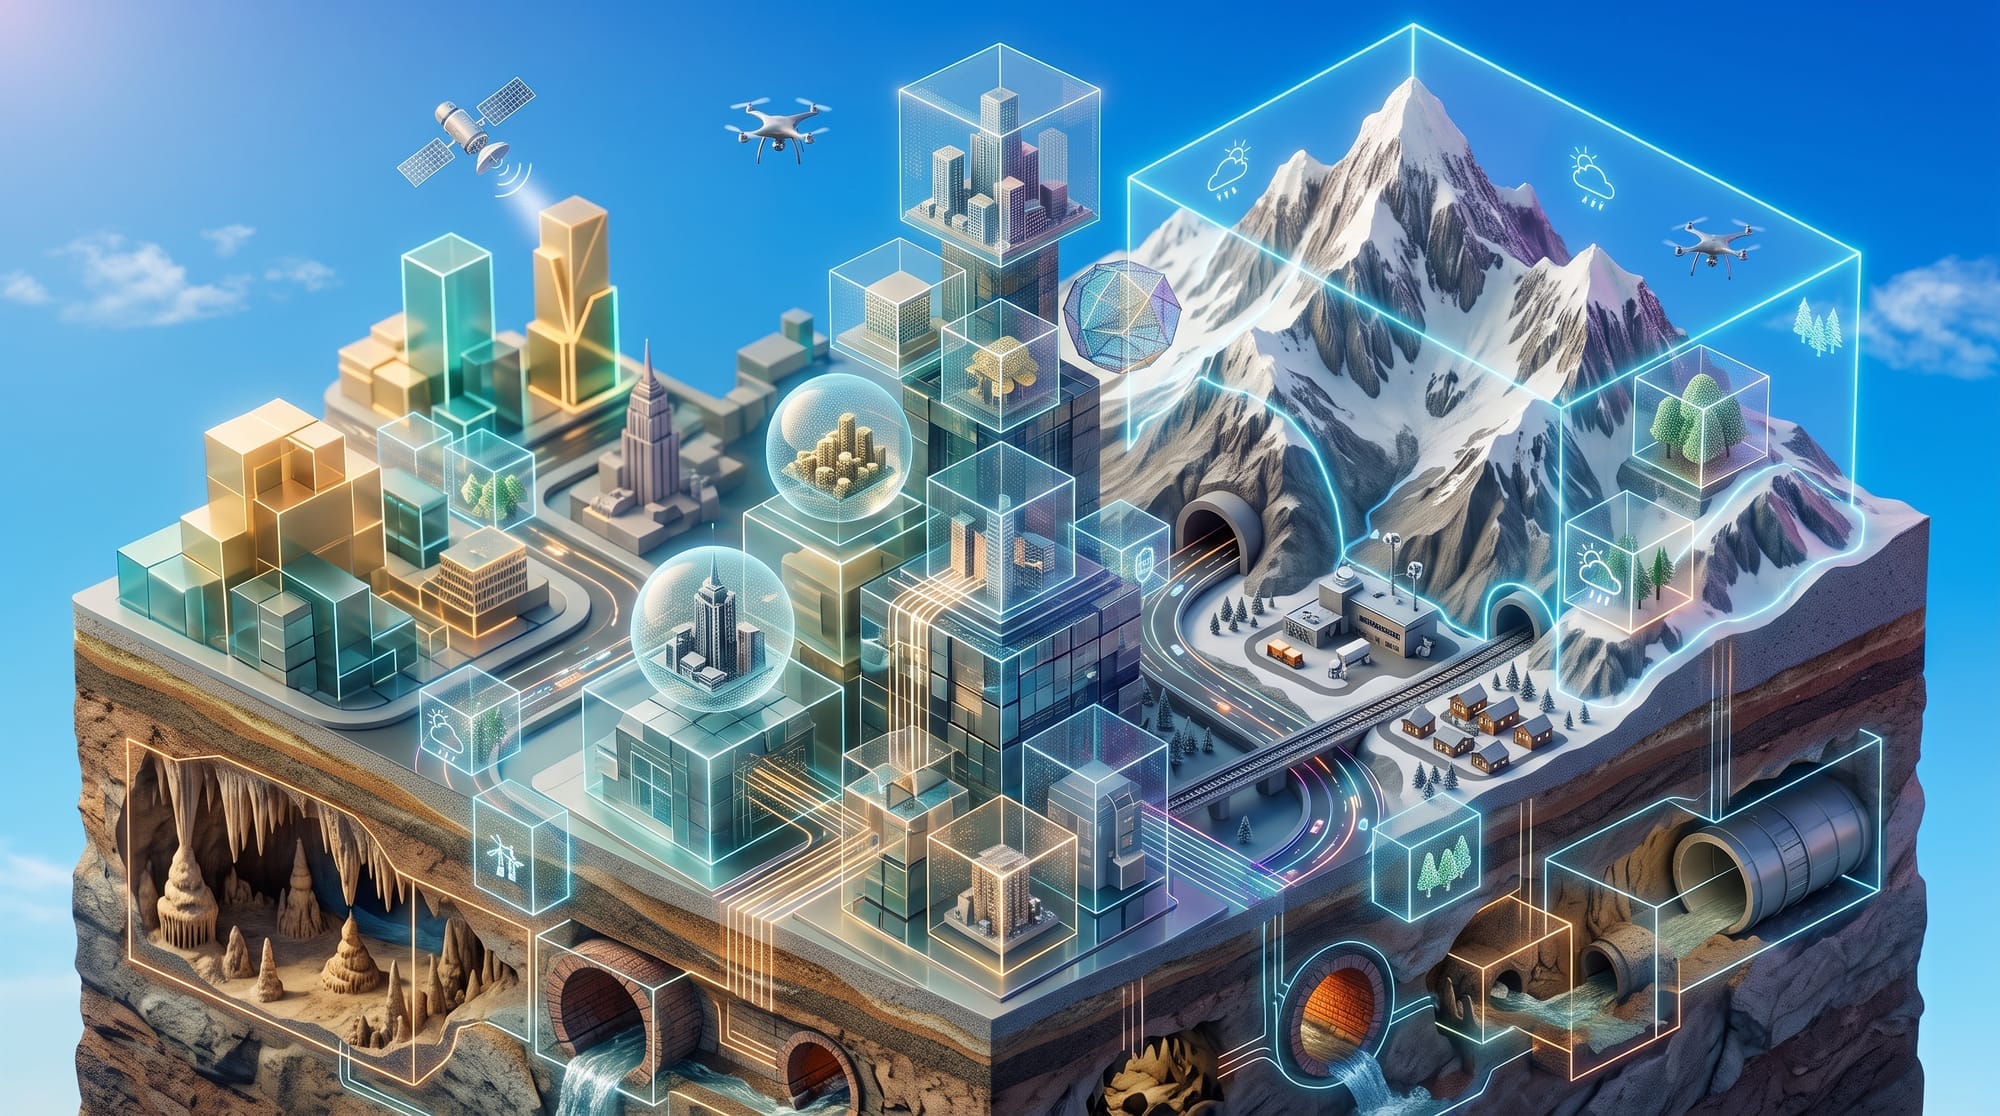
In recent years, the use of 3D spatial data has rapidly expanded in the development of urban digital twins, metaverse environments, and smart cities. However, highly detailed 3D city models and point cloud data captured through laser scanning can be extremely large, making them difficult to display and operate smoothly in web browsers and on mobile devices.
3D Tiles, an open standard, was developed to address this challenge.
This article explains what 3D Tiles is, how it works, how it differs from conventional 2D tiles, the characteristics of its evolving versions, and examples of how it is used in real-world projects.
An Overview of 3D Tiles
3D Tiles is a data standard designed to stream and render massive 3D geospatial datasets—ranging from terabytes to petabytes—efficiently across web, desktop, and mobile applications.
It was originally developed under the leadership of CesiumGS and was formally adopted as a Community Standard by the Open Geospatial Consortium, or OGC, an international organization for geospatial standards.
Its purpose is to efficiently deliver a wide variety of 3D data—including BIM models, terrain, photogrammetry, and point clouds—to users without requiring all data to be loaded at once.
Why Is 3D Tiles Necessary?
The importance of 3D Tiles becomes clearer when it is compared with the conventional 2D tiles commonly used in web maps, such as XYZ tiles.
The Conventional 2D Tile Approach
In a 2D map, the Earth is divided into a latitude-and-longitude grid, usually using a quadtree structure. Depending on the zoom level, image tiles such as PNG or JPEG files, or vector tiles such as MVT, are delivered to the user.
A 3D environment, however, also has height along the Z-axis. The data that should be displayed changes dynamically depending on the camera angle, viewing direction, and distance from the object.
The 3D Tiles Approach
3D Tiles does more than divide data across a flat surface. It hierarchically divides an entire three-dimensional space using spatial bounding volumes.
When the camera is close to an area or zoomed in, the viewer loads highly detailed 3D models with complex geometry and high-resolution textures.
When the camera is far away or zoomed out to show a wide area, it loads simplified geometry or lower-resolution data.
This allows the system to retrieve and render only the data required for the current view instead of loading unnecessary data that is not visible on the screen.
The Core Mechanisms of 3D Tiles
3D Tiles achieves high-speed rendering through several key technical mechanisms.
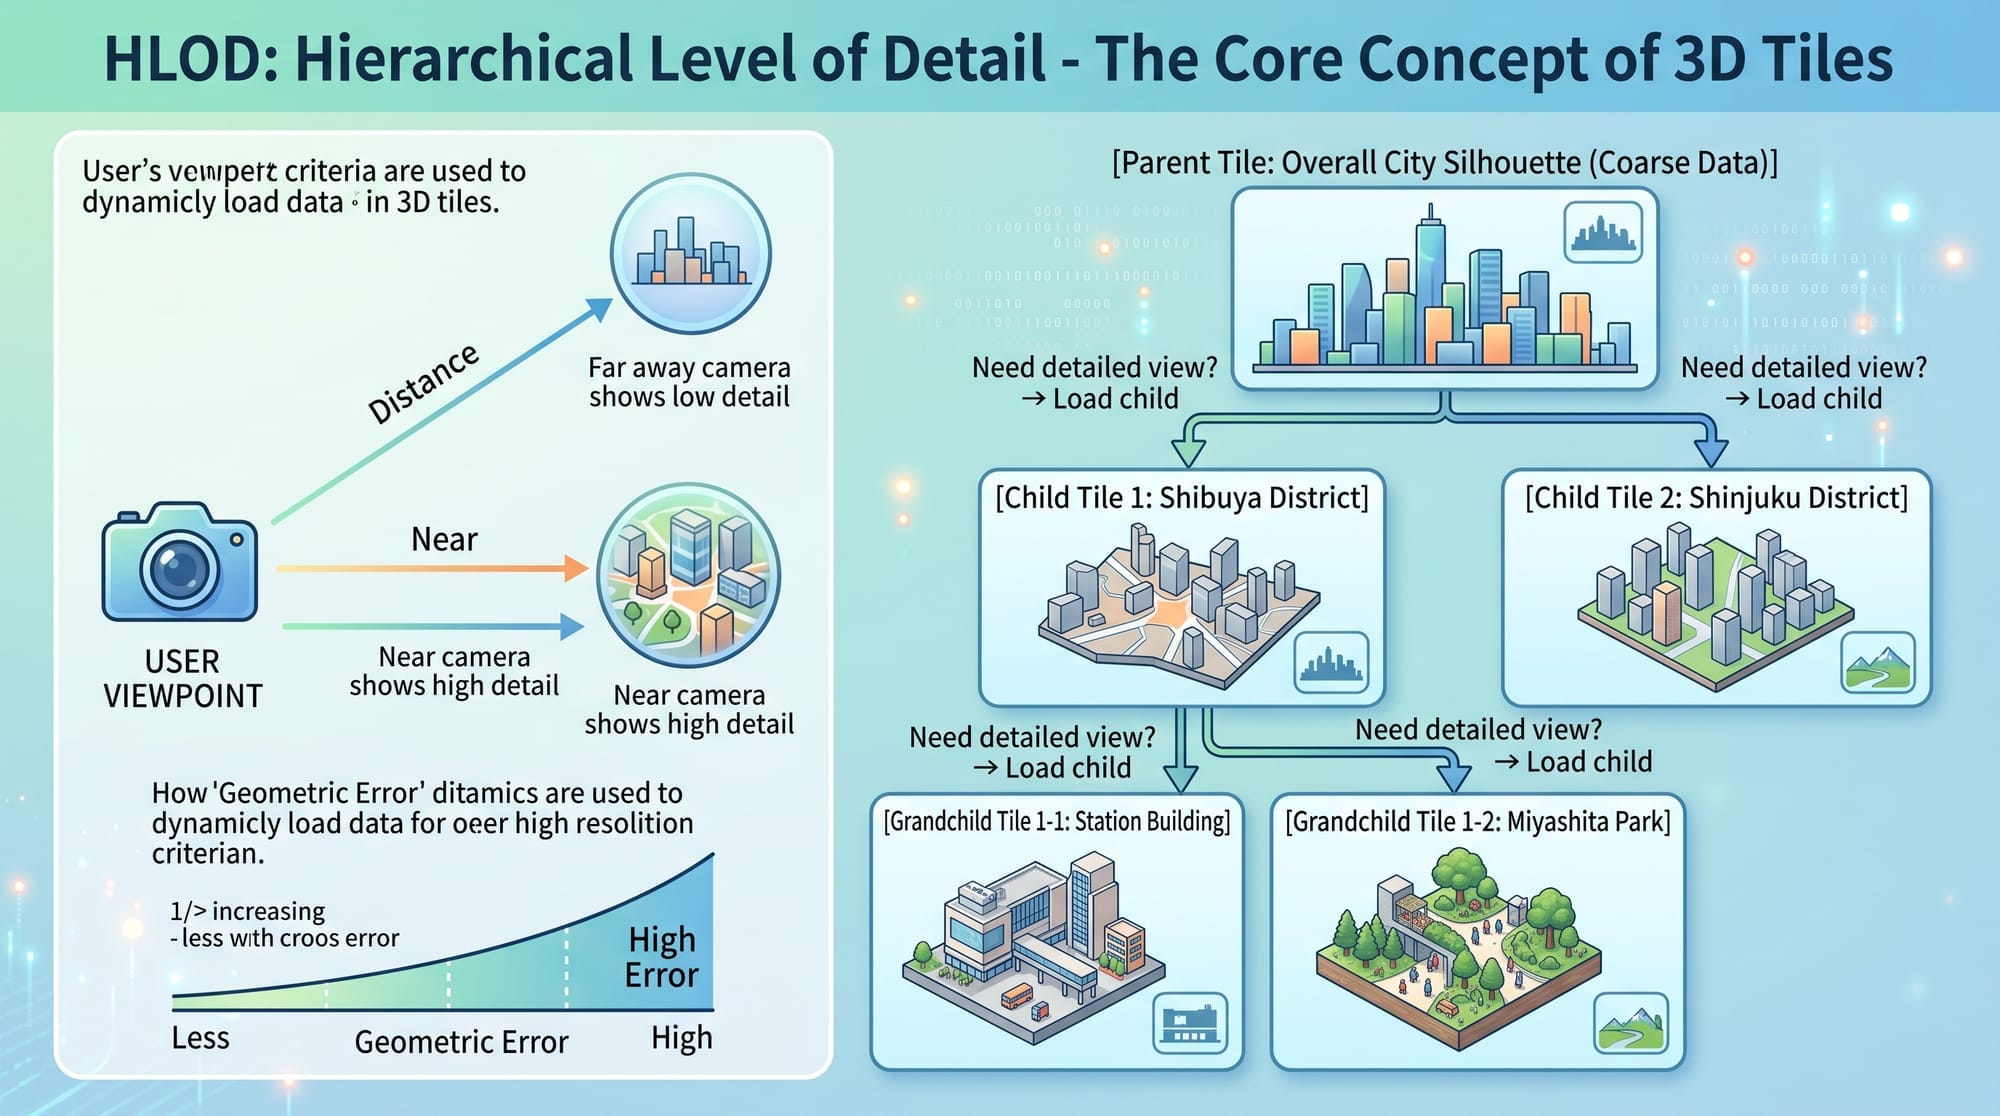
1. HLOD: Hierarchical Level of Detail
HLOD is one of the most important concepts in 3D Tiles.
Based on the distance from the camera and a value known as geometric error—the visual difference caused by model simplification—the viewer dynamically determines and loads the most appropriate level of detail.
Like moving from the root of a tree toward its leaves, the viewer switches from parent tiles, which cover a wider area at lower detail, to child tiles, which cover smaller areas at higher detail, as necessary.
2. Flexible Spatial Partitioning with Bounding Volumes
When dividing space, 3D Tiles is not limited to a simple fixed grid. Bounding volumes can be defined flexibly according to the density and shape of the data.
The main bounding volume types include:
Box
An oriented rectangular box suitable for groups of buildings, individual city blocks, roads, and other irregularly oriented data.
Sphere
A sphere defined by a center point and radius. It can be useful for broad areas or for fast distance-based calculations.
Region
An area defined by minimum and maximum longitude, latitude, and height values. It is suitable for geographically referenced regions that follow the curvature of the Earth.
3. tileset.json as an Index
A file named tileset.json manages the overall 3D Tiles dataset.
It describes information such as:
- The hierarchical tree structure of the tiles
- The position and dimensions of bounding volumes
- The geometric error assigned to each tile
- Links to the actual content referenced by each tile, such as 3D models
The viewer reads this file to determine which data should be loaded and rendered for the current camera view.
Differences Between 3D Tiles 1.0 and 1.1
3D Tiles has continued to evolve. Version 1.1 modernized how data and metadata are managed.
| Feature or Specification | 3D Tiles 1.0 | 3D Tiles 1.1 |
|---|---|---|
| File formats | Uses dedicated formats such as .b3dm for batched 3D models, .i3dm for instanced models, .pnts for point clouds, and .cmpt for composite tiles | Uses standard glTF 2.0 files, including .gltf and .glb, as the primary content format. Legacy 1.0 formats are deprecated |
| Implicit tiling | Not supported. The tree structure generally needs to be written explicitly in JSON, which can make the JSON file extremely large for massive datasets | Supported. Regular subdivision rules such as quadtrees and octrees can be defined in advance, enabling efficient management of large tile hierarchies |
| Metadata extensibility | Limited primarily to tile-level metadata and batch tables | Structured semantic metadata can be associated with tilesets, tiles, content groups, individual features, vertices, and other levels |
| Multiple contents | Generally one content resource per tile | A single tile can reference multiple content resources, such as terrain, buildings, and vegetation |
Major Use Cases
3D Tiles is already used as foundational infrastructure in a wide range of commercial and public projects.
1. Japan’s Project PLATEAU
Project PLATEAU is a Japanese government initiative that develops open 3D city models with the aim of supporting urban digital twins across Japan.
One of the main formats used to distribute PLATEAU data efficiently on the web is 3D Tiles.
Users can view 3D buildings together with semantic attributes such as building use, year of construction, urban planning information, and disaster-related information.
2. Google Photorealistic 3D Tiles
Google’s Map Tiles API provides access to large-scale, photorealistic 3D geographic data in the 3D Tiles format.
This allows developers to stream Google’s high-quality 3D map data into compatible renderers such as CesiumJS and Cesium for Unreal.
The data can be used to create immersive geographic visualizations, planning applications, virtual exploration tools, and location-based experiences.
3. Digital Twins for Infrastructure and Construction
Large-scale infrastructure assets such as roads, tunnels, dams, and construction sites can be captured through drone photogrammetry or laser scanning.
The resulting datasets may contain hundreds of millions of points.
By converting these datasets into 3D Tiles, teams can share and inspect them in a browser for purposes such as:
- Construction progress management
- Infrastructure inspection
- Maintenance planning
- Remote collaboration
- Comparison between design and as-built conditions
Major Rendering Engines That Support 3D Tiles
Because 3D Tiles is an open standard that is not tied to a single platform, it is supported by a variety of development frameworks and engines.
CesiumJS
CesiumJS is an open-source JavaScript library developed by Cesium for advanced rendering of 3D Tiles in web browsers.
It provides functions for tile selection, streaming, level-of-detail control, styling, metadata access, and interaction with geospatial data.
Cesium for Unreal, Unity, and Omniverse
Cesium provides plugins that stream high-precision geospatial data into game engines and simulation platforms.
These plugins make it possible to integrate 3D Tiles into realistic games, training simulators, urban planning tools, and digital twin applications.
deck.gl and loaders.gl
These visualization frameworks were originally developed by Uber.
They support the loading and visualization of large-scale geospatial datasets, including 3D Tiles.
ArcGIS by Esri
ArcGIS products provide functions for importing, converting, and visualizing various forms of 3D geospatial data.
Support and available functions may differ depending on the ArcGIS product and version being used.
Support for glTF
3D Tiles is not simply a mechanism for dividing a 3D space into smaller pieces.
With the introduction of 3D Tiles 1.1, standard glTF and GLB assets can be referenced directly, while structured semantic metadata can be associated with objects at different levels.
This makes it possible to combine a 3D model with real-world information such as:
- Materials
- Temperature
- Sensor data
- Demographics
- Real estate values
- Equipment status
- Maintenance records
Applications can then filter, style, query, or analyze that information dynamically on the web.
This has helped 3D Tiles develop into a practical foundation for digital twin platforms rather than remaining only a 3D visualization format.
For developers working with geospatial applications and smart city projects, understanding 3D Tiles has become increasingly important.
PLATEAU Is Also Distributed Using Tiled Data
Project PLATEAU distributes its source 3D city model data primarily in CityGML format.
CityGML files may be divided into regional mesh units for data distribution and management. When the data is converted for web visualization, it can also be transformed into 3D Tiles with a hierarchical tile structure.
In a web viewer, densely built-up areas can be divided into smaller tiles, while less detailed areas can be represented using larger tiles.
The resulting tile hierarchy allows the viewer to load appropriate levels of detail according to the camera position and viewing distance.
How Are Buildings That Cross Tile Boundaries Handled?
A long building such as Tokyo Station may cross a regional boundary or the boundary of a tile.
If the building were physically divided at every tile boundary, it could create problems such as:
- Selecting only one part of the building
- Misaligned textures at the boundary
- Duplicate or inconsistent metadata
- Difficulty treating the building as one semantic object
For that reason, data conversion systems may attempt to preserve buildings as coherent objects wherever possible.
The exact method, however, depends on the tiling pipeline and the dataset design.
One possible method is to assign an entire object to one tile using a representative point, centroid, or other spatial rule.
Another method is to define bounding volumes that extend beyond neighboring spatial divisions so that the complete object remains enclosed by the tile’s bounding volume.
Because 3D Tiles allows flexible bounding volumes, neighboring tile volumes are not required to form a perfectly non-overlapping grid.
However, 3D Tiles itself does not prescribe one universal rule for assigning every building to a tile.
Why Individual Buildings Can Be Selected
A PLATEAU dataset does not necessarily contain files with names such as Tokyo-Station.obj.
Instead, a tile may contain multiple building features.
If feature-level identifiers and metadata are preserved during conversion, a viewer such as CesiumJS can recognize a selected building as an individual feature.
For example, clicking Tokyo Station may allow the viewer to:
- Identify the selected building
- Highlight the complete feature
- Retrieve its ID
- Display attributes such as structure, use, or year of construction
The ability to preserve feature-level identities and metadata is one of the reasons 3D Tiles is useful for smart city and digital twin applications.
Flexible Tiling Methods
3D Tiles datasets are not restricted to a single fixed two-dimensional tiling scheme such as Web Mercator XYZ tiles.
A tileset can use a spatial subdivision structure suited to the shape, density, and distribution of its data.
Understanding why this flexibility matters reveals one of the most important strengths of the standard.
Why Not Use Only Web Mercator Tiles?
In conventional 2D web maps such as Google Maps or Mapbox, the Earth is projected onto a flat square and divided repeatedly into four smaller squares using a quadtree.
This approach is efficient for map imagery and two-dimensional vector data.
However, using only this type of two-dimensional partitioning for all 3D data can introduce several limitations.
1. Limited Representation of Height
Web Mercator tiles primarily divide space horizontally.
A subway station, a high-rise building, and an aircraft route could occupy the same latitude-and-longitude area while existing at very different heights.
If all of this data were always stored in the same horizontal tile, the tile could become extremely large.
For volumetric datasets, a three-dimensional subdivision method such as an octree may be more suitable.
2. Distortion Near the Poles
The Web Mercator projection increasingly distorts scale toward the North and South Poles.
This makes it unsuitable as the only spatial representation for all types of globe-scale 3D data.
3D Tiles can instead represent geospatial content in a global 3D coordinate system and use bounding volumes that follow the Earth’s curvature.
3. Uneven Data Density
Data density differs enormously between locations.
A tile covering the middle of the Pacific Ocean may contain almost no data, while a tile covering central Shinjuku may contain thousands of complex buildings.
Uniformly dividing both areas in exactly the same way can be inefficient.
3D Tiles Designs Spatial Volumes Around the Data
Instead of forcing every dataset into one fixed grid, 3D Tiles allows a tileset to define spatial bounding volumes that fit the data.
The available bounding volume types can be selected according to the characteristics of the dataset.
Box
An oriented box can closely fit an individual building, a tilted road, an engineering model, or another spatial object.
Unlike a simple axis-aligned box, it can be rotated to match the orientation of the data.
Sphere
A sphere is defined by a center point and radius.
It is useful for fast visibility and distance calculations, especially for broad datasets viewed from many directions.
Region
A region is defined by minimum and maximum longitude, latitude, and height values. It is suitable for enclosing large urban or geographic areas while following the shape of the Earth.
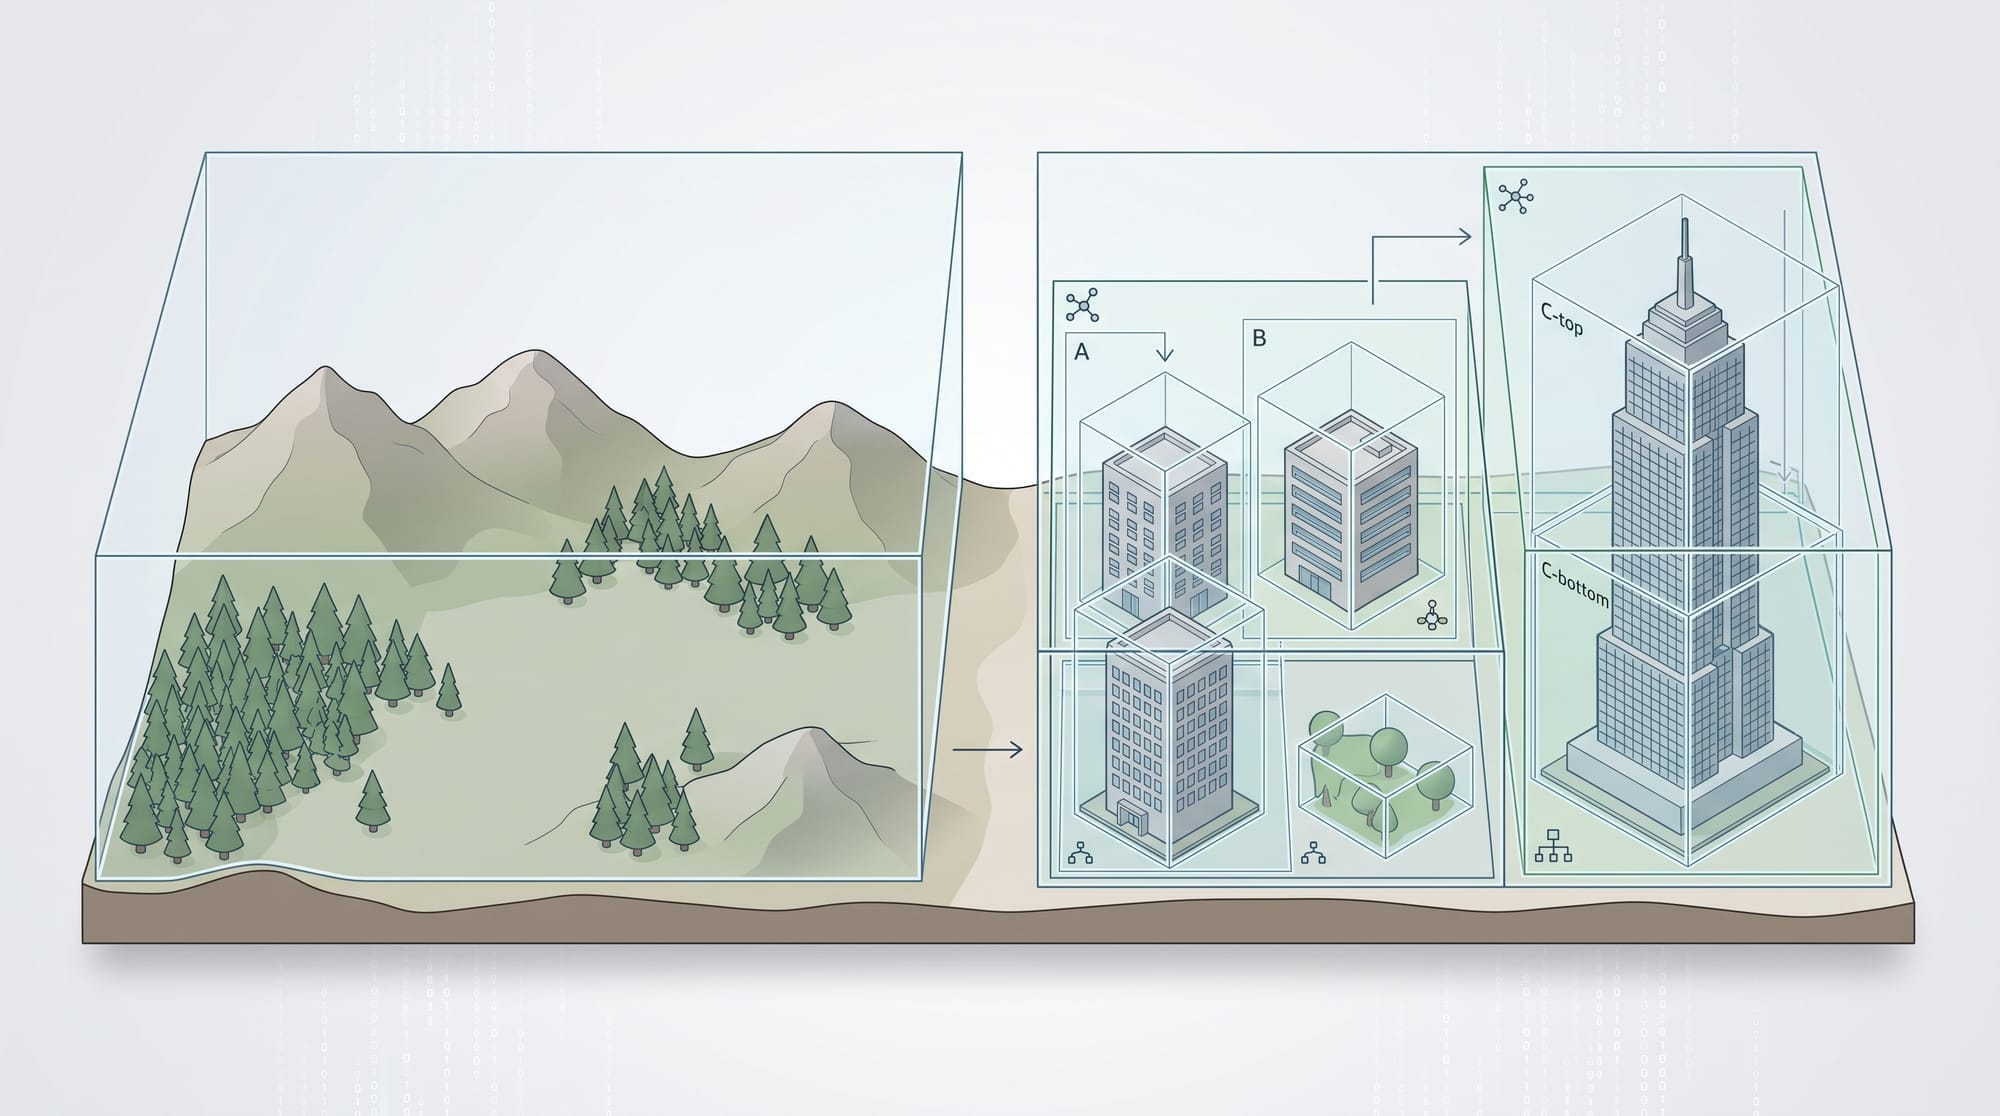
Areas that contain no relevant data do not necessarily need to be represented by populated tiles.
Examples of Tiling for Different Services
Because 3D Tiles allows flexible spatial structures, different datasets can use very different subdivision methods.
PLATEAU 3D City Models
PLATEAU’s source CityGML data may be distributed in regional mesh units.
When converted into 3D Tiles, areas with dense building data can be subdivided into smaller child tiles, producing a hierarchical tree structure suited to web visualization.
Google Photorealistic 3D Tiles
Google provides its photorealistic 3D geospatial data through an OGC 3D Tiles tileset.
Developers access the dataset through a root tileset URL, and a compatible renderer requests the required child tiles as the user explores the map.
The exact internal subdivision algorithm is not fully described in the public API documentation.
Drone-Captured Construction Sites
A construction site captured by a drone does not necessarily need to follow a global latitude-and-longitude grid.
The site can be divided using a local coordinate system based on the boundaries of the construction area.
The resulting photogrammetry mesh or point cloud can then be tiled according to the density and shape of the site.
Why Different Types of 3D Data Can Be Combined in One Scene
If 3D Tiles were restricted to a single Web Mercator-style subdivision rule, it would be more difficult to integrate data such as local drone point clouds, indoor BIM models, and global city models.
Instead, each tileset defines its own:
- Spatial hierarchy
- Bounding volumes
- Geometric errors
- Content resources
- Transformations
- Metadata
A compatible viewer interprets each tileset independently and places its content in the shared 3D coordinate space.
This flexible design makes it possible to combine datasets with very different origins and scales in the same digital twin environment.
Overlaying Tilesets with Different Partitioning Methods
Libraries such as CesiumJS can load multiple 3D Tiles tilesets into the same scene.
Each tileset can maintain its own hierarchical structure and evaluate the level of detail required for the current camera view.
This enables advanced combinations of independently managed datasets.
SSE: Screen-Space Error and Independent LOD Switching
CesiumJS uses a metric called Screen-Space Error, or SSE, to determine when a tile should be replaced by more detailed child tiles.
The calculation considers information such as:
- The camera position
- The camera angle
- The field of view
- The tile’s geometric error
- The distance between the camera and the tile
- The display resolution
A simplified conceptual flow looks like this:
Shared camera position, direction, and zoom
   │
   ├── 3D Tiles A: PLATEAU buildings
   │      └── Selects and loads an appropriate LOD from its own tile tree
   │
   └── 3D Tiles B: A company’s drone point cloud
          └── Selects and loads an appropriate LOD from its own tile tree
The camera information is shared, but each tileset evaluates its own hierarchy using its own geometric error and bounding volume data.
As a result, the background PLATEAU buildings may remain at a relatively coarse level of detail while a high-resolution point cloud at the center of the view is refined to its most detailed level.
Why Different Tile Structures Do Not Conflict
Different 3D Tiles datasets may use completely different invisible spatial divisions.
One may be based on regional city meshes, while another may be based on the boundary of a drone-surveyed construction site.
They can still be rendered together because the viewer does not need the boundaries of the different tilesets to match.
Conceptually, a CesiumJS rendering process performs operations such as:
- Obtain the current camera view.
- Traverse each 3D Tiles tileset registered in the scene.
- Evaluate which tiles are required from each tileset.
- Download the referenced content asynchronously.
- Prepare the content for GPU rendering.
- Render the visible content in the shared scene.
From the renderer’s perspective, the content may represent PLATEAU buildings, drone photogrammetry, BIM models, or point clouds.
Each tileset provides its own instructions through its tileset hierarchy and referenced content.
Independent Controls Available to Developers
This architecture allows developers to control individual tilesets separately.
Show or Hide Individual Tilesets
A developer can hide the PLATEAU buildings while displaying only a company’s own point cloud or BIM dataset.
Adjust Rendering Quality for Each Tileset
CesiumJS provides a property called maximumScreenSpaceError.
A higher value generally improves performance by allowing coarser tiles to remain visible longer, while a lower value requests more detailed tiles and improves visual quality.
For example:
- Background PLATEAU buildings can use a higher SSE value to reduce rendering load.
- A primary construction BIM model can use a lower SSE value so that detailed geometry is displayed from a greater distance.
This enables developers to assign different performance and quality priorities to each dataset.
Conclusion: How 3D Tiles Is Shaping the Future of Digital Twins
In conventional 2D digital maps, new value is often created by overlaying a company’s own polygons, markers, and business data on top of aerial imagery or a base map.
With 3D Tiles, independently managed layers of three-dimensional spatial data can be combined on the web in a similar way.
The true innovation of 3D Tiles is not limited to making large data easier to stream.
Its strengths also include:
- A flexible spatial hierarchy that is not restricted to one fixed two-dimensional tiling scheme
- Bounding volumes that can be adapted to the shape and density of the data
- Hierarchical level-of-detail selection based on geometric and screen-space error
- Structured metadata that preserves semantic information
- The ability to combine independently created 3D datasets in one shared scene
These design principles make it possible to combine data with completely different origins and scales, including:
- Project PLATEAU’s national-scale open city data
- Google’s photorealistic 3D geographic data
- Drone-captured construction sites
- Point clouds
- BIM models
- Sensor information
- Local infrastructure data
As the implementation of spatial computing and smart cities accelerates, 3D Tiles is evolving beyond a single visualization format into shared infrastructure for representing, analyzing, and simulating the real world in digital space.
For developers and organizations working on geospatial applications and urban digital transformation, understanding the characteristics of 3D Tiles and using them appropriately can provide a major advantage when creating the next generation of digital services.
Struggling to turn ideas into reality? With a proven track record of over 1,000 clients, our agile and flexible team will accelerate your business growth.
Book a Free ConsultationMore on "XR & 3D Web"
GLB Texture Editor: Edit 3D Model Textures and Materials in Real Time in Your Browser
GLB Texture Editor is a browser-based tool for editing 3D model textures and materials in real time. Upload a GLB file, adjust base color, roughness, metalness, transparency, UV mapping, position, rotation, scale, and projection settings, then preview and export the updated model.
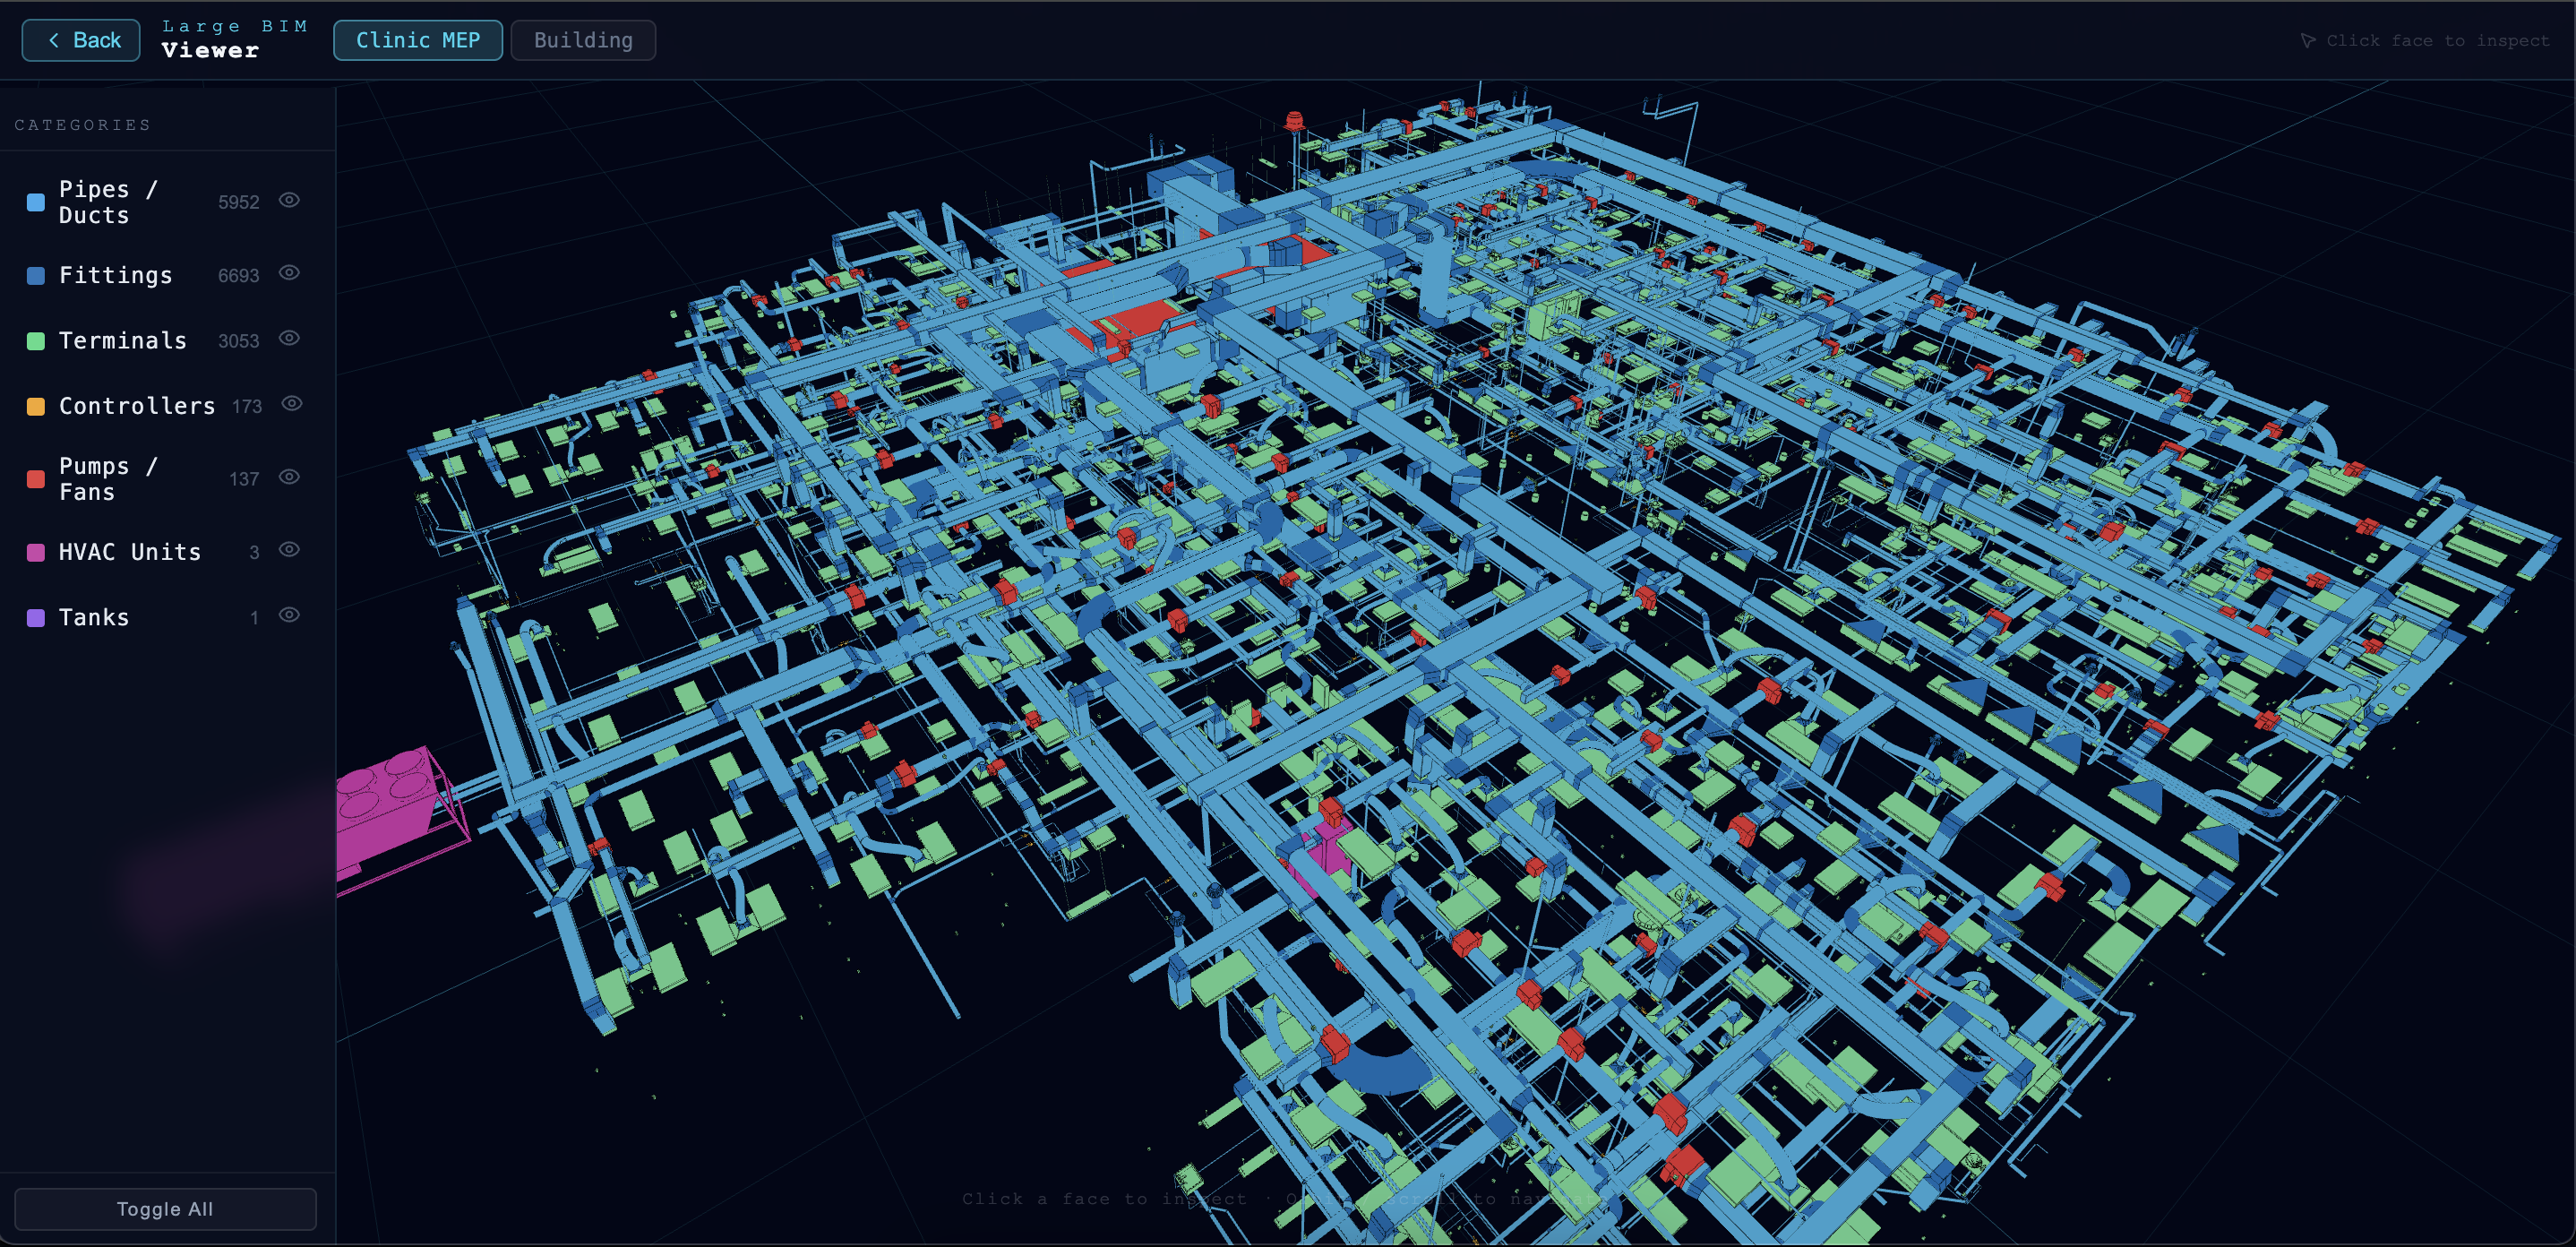
High-Performance Web BIM Viewer for Large IFC Models
This PoC converts large IFC models into optimized GLB files by BIM category for faster browser rendering. It demonstrates flexible layer controls, element data panels, smooth 3D navigation, and reduced z-fighting, while outlining a future automated IFC-to-GLB workflow.
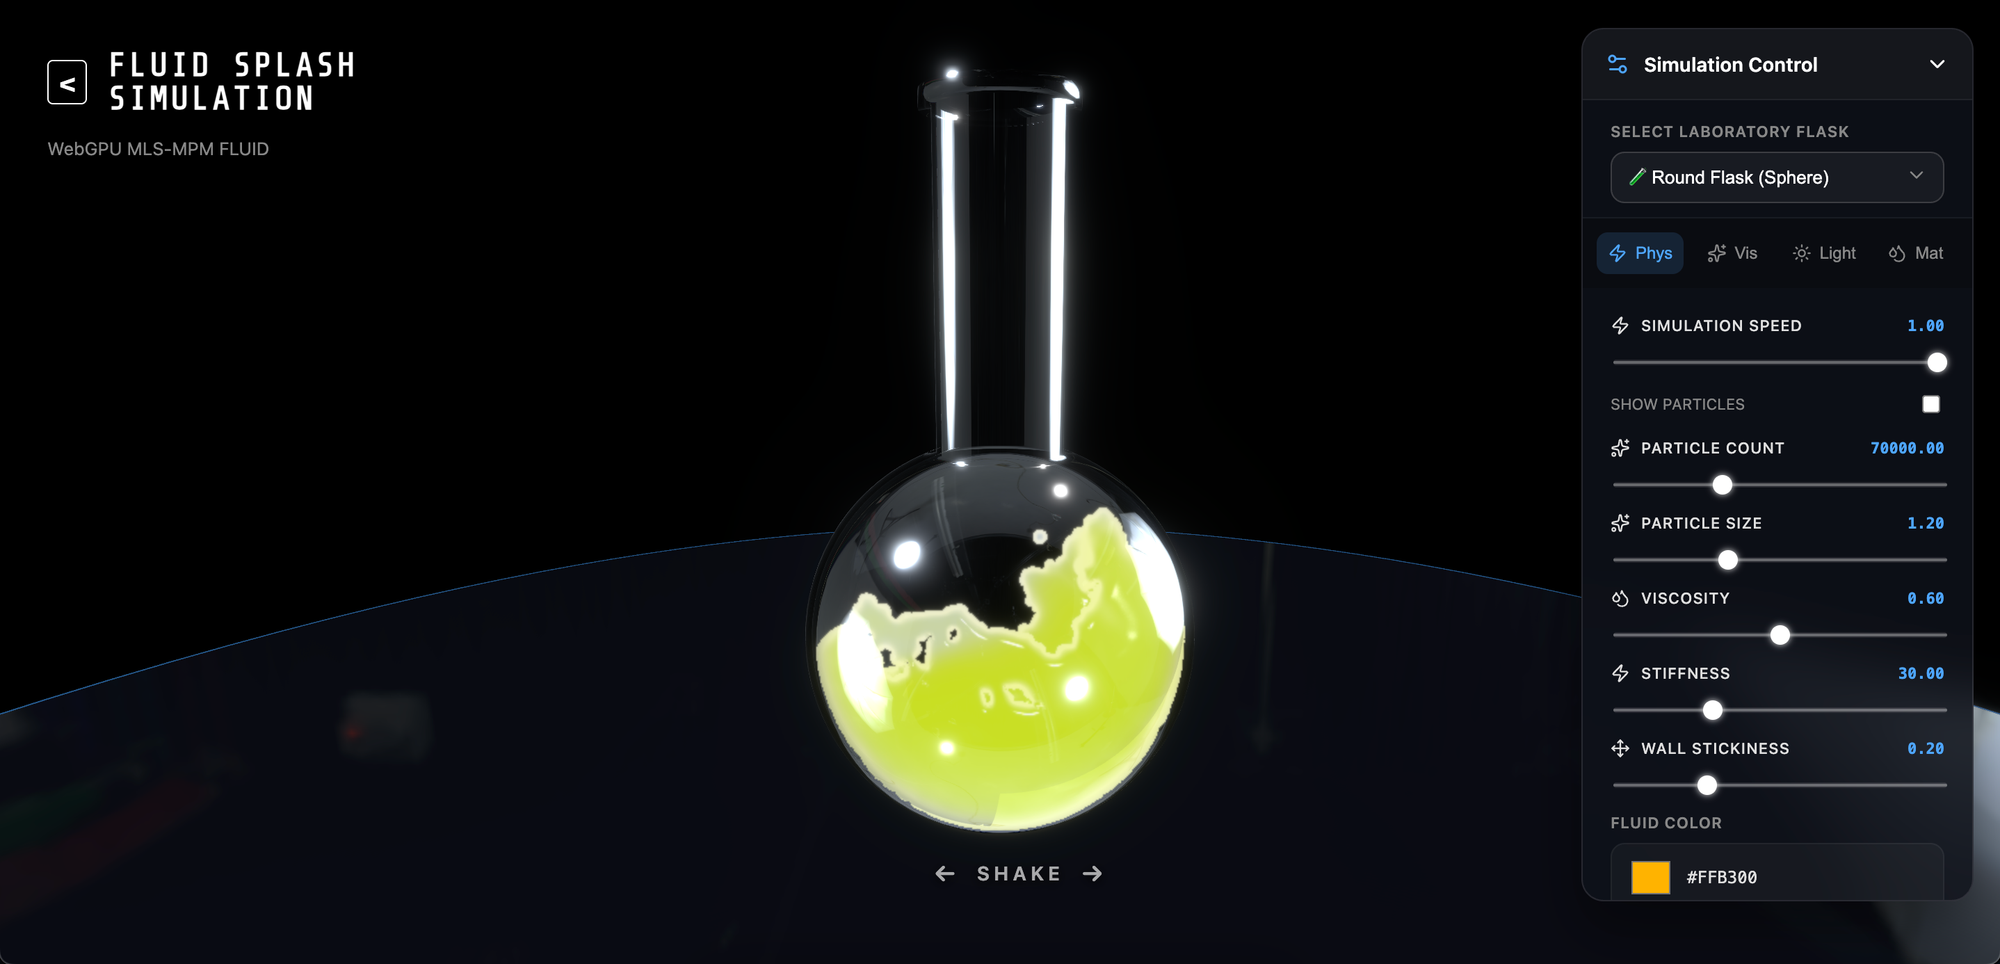
Implementing Web-based Fluid Simulation: The Potential of WebGL and WebGPU
Explore how WebGL and WebGPU enable real-time fluid simulation directly in the browser, transforming XR, gaming, and digital twins.
